- $SEI trades in a descending channel, hinting at a potential drop to $0.49.
- The 10-day SMA acts as a resistance, guiding current bearish trends.
- Timing aligns with a global crypto dip, suggesting broader market influence.
Cryptocurrency enthusiasts are buzzing about $SEI following a detailed technical analysis shared by @ali_charts on X earlier today.
The post, highlights $SEI trading within a descending channel on a 3-day chart, a bearish pattern that often indicates a continued downtrend unless a breakout occurs. According to howtotrade, descending channels are reliable when price reversals consistently respect the upper and lower boundaries, a trend observed in the provided chart.
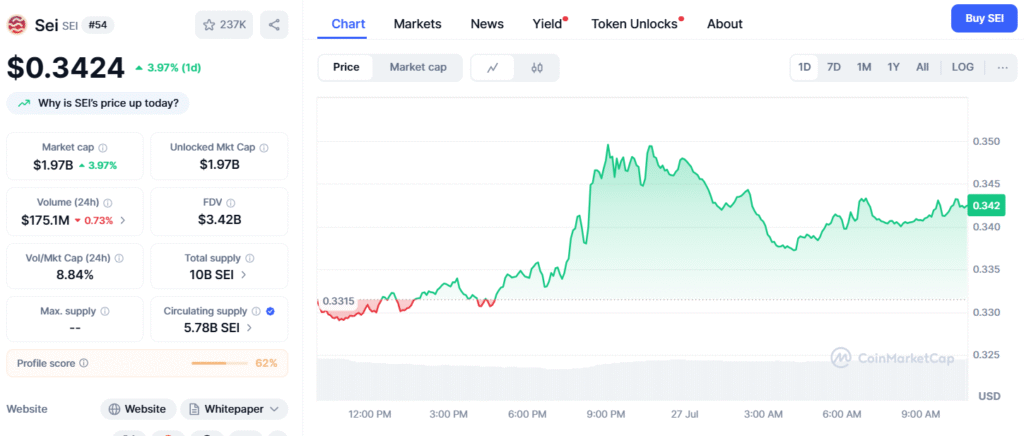
A key observation is the role of the 10-day Simple Moving Average (SMA) as a resistance level, a technique widely used by traders to assess trend direction, as noted by investopedia. The analysis suggests $SEI could drop to $0.49 if the current pattern persists, despite its current market price of $0.3473, according to coinmarketcap data.
This potential target has sparked mixed reactions, with some X users like @famiweb33 and @0xash47 expressing bullish optimism, while others, such as @HK3NSR, remain cautiously curious.Interestingly, the timing of this analysis aligns with a broader market dip reported by CoinGecko today, suggesting $SEI’s movement may reflect global cryptocurrency sentiment rather than isolated momentum. The descending channel’s slope, combined with the SMA’s resistance, indicates a challenging period ahead unless $SEI breaks upward, a scenario that could shift the narrative to a bullish reversal.

For investors, this analysis serves as a critical checkpoint. Monitoring for a breakout above the channel or a failure to hold the SMA will be pivotal. As the crypto market remains volatile, with grandviewresearch.com projecting a 13.1% CAGR for the industry through 2030, $SEI’s next move could set a precedent for smaller-cap coins.
Disclaimer: This article is for informational purposes only and does not constitute financial advice. CoinCryptoNewz is not responsible for any losses incurred. Readers should do their own research before making financial decisions.


