- $SHIB is up by 0.37% as it shows strong support above the 1370 level.
- Analysts predict a breakout for Shiba Inu if it surpasses the 0.00001483 level.
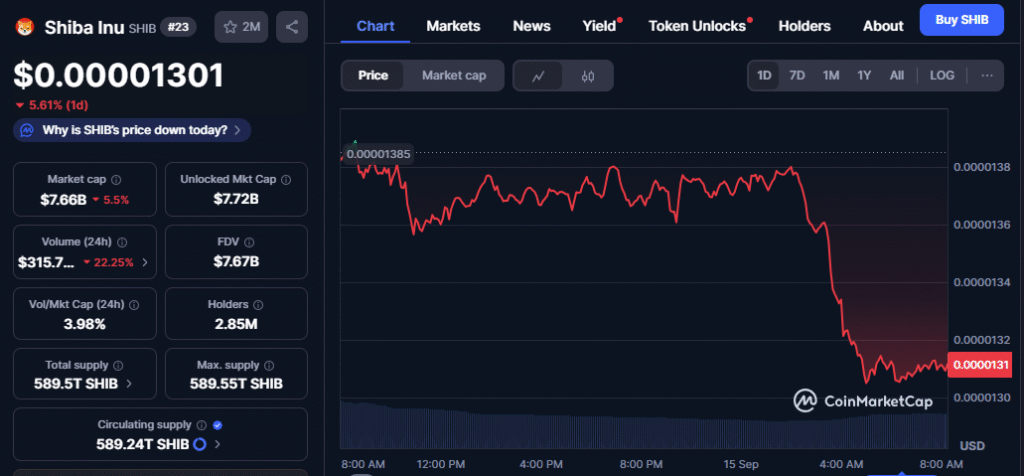
- Shiba Inu’s price is experiencing volatility, with recent losses of 5.61%.
Shiba Inu ($SHIB) has demonstrated a positive shift in momentum recently. Trading at 0.00001373 USDT, the cryptocurrency has gained 0.37% in the last few hours. This uptick follows strong support at the 1370 level, a key area on the price chart.
The coin has bounced from this level multiple times, showing resilience as it attempts to reach new highs. Analysts point to this support zone as crucial for $SHIB’s short-term outlook, suggesting that further gains could follow if this momentum is sustained.
The latest price action signals that $SHIB could break its previous high of 0.00001483 USDT. A break above this level could trigger a significant rally.
Analysts Predict Potential Rally as $SHIB Forms Key Technical Pattern
Traders are keeping a close watch on Shiba Inu’s technical chart as the coin approaches a crucial moment. Currently trading at 0.00001471 USDT, $SHIB has seen a 5.75% increase
Recent data suggests that the coin is forming a descending triangle, a pattern that often signals a potential breakout. This chart formation has drawn attention, as it suggests the possibility of a sharp upward move if $SHIB breaks free from this pattern.
Furthermore, a significant support zone has emerged in recent days, with price stability observed above the 1370 level. Increased buying volume has also been noted, indicating growing interest from investors.
Shiba Inu Faces Setback with Recent Downtrend
Despite the recent positive momentum, Shiba Inu has encountered some volatility in the past 24 hours. As of press time, $SHIB is trading at 0.00001301 USDT, reflecting a drop of 5.61%.

The price chart shows a sharp decline, with $SHIB falling from 0.00001385 earlier in the day. This drop has raised concerns among traders, as the cryptocurrency faces downward pressure following an initial surge.
Disclaimer: This article is for informational purposes only and does not constitute financial advice. CoinCryptoNewz is not responsible for any losses incurred. Readers should do their own research before making financial decisions.


