- Ethereum’s cyclical nature remains clear as each rally since 2016 has been followed by sharp corrections, shaping long-term price trends.
- Risk model zones signal phases of opportunity or overheating, with blue/green phases aligning with stronger entry points and red/orange phases marking speculative tops.
- The current cycle shows Ethereum entering higher risk territory, as momentum remains strong but speculative pressure grows above $4,500
Ethereum’s market activity has shifted into a phase that shows rising risk signals. The current trend reflects both opportunity and concern. Data from IntoTheCryptoverse highlights these movements across Ethereum’s market cycles since 2016.
Ethereum Price Trend
Ethereum has moved through several rallies since its early years. The price surged in late 2017, again in 2021, and more recently in 2024–2025. Each rise ended with a correction that underlined the asset’s cyclical market behavior.
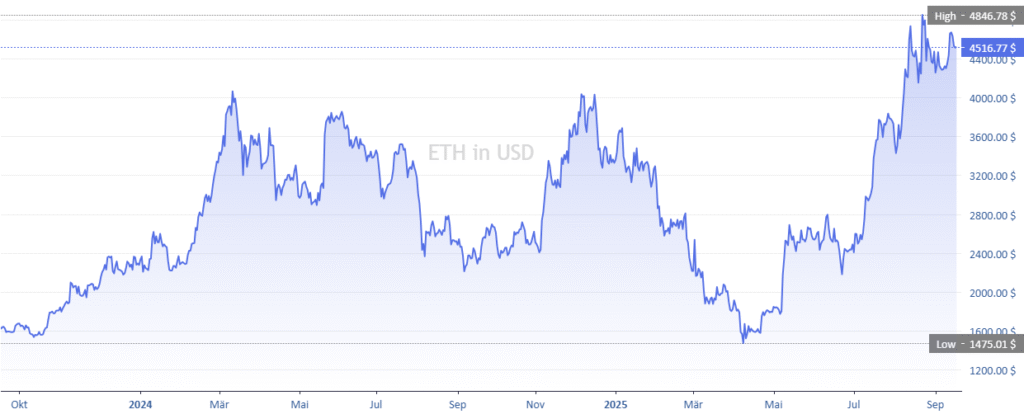
The price path shows that short-term gains often attract speculative activity. This pattern is visible in every major cycle recorded since 2016. The latest surge again places Ethereum at elevated levels above $4,000.
Market behavior highlights how quickly Ethereum can shift from growth to correction. The record shows strong advances followed by significant retracements. This repeating cycle sets the stage for analyzing short-term bubble risk.
Risk Indicator Levels
The IntoTheCryptoverse model shows how risk zones align with market behavior. Red and orange bars marked overheated peaks in 2017 and 2021. These phases preceded sharp corrections that shaped the following bear markets.
Yellow and green zones appeared during consolidations and mid-cycle growth phases. These levels reflected periods of moderate activity with balanced momentum. They often provided steady ground before either rallying or falling further.
Blue zones represented the lowest risk periods. These appeared during bear markets and long corrections. They highlighted accumulation opportunities across Ethereum’s history.
Historical and Current Context
The 2017 surge saw Ethereum peak near $1,400. The model then highlighted extreme risk before a multi-year decline. The 2021 cycle showed the same behavior at new highs above $4,000.

Source: blockchaincenter
Between 2022 and 2023, the model highlighted lower risk conditions. The price corrected heavily, and Ethereum moved into extended consolidation. These phases presented accumulation opportunities for long-term participants.
The current 2024–2025 period again shows rising risk. Ethereum now trades above $4,500 with signals turning orange. The model suggests that the market has entered a more speculative environment.


