- False social media posts linking Forbes to a $60,000 XRP prediction are proven fake, aimed at promoting unrelated tokens.
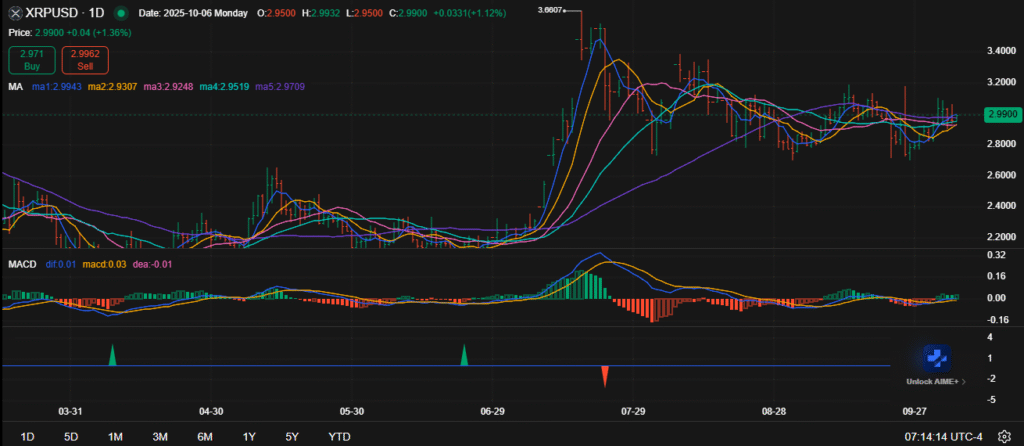
- XRP presents a steady rising trend, and it is trading at an approximate of 2.99 where moving averages indicate the presence of the bullish trend.
- The enhancement of MACD indicators and stable support around the mark of 2.90 is an indicator that XRP might push above the level of 3.00 as the markets gain optimism.
The XRP is under new scrutiny due to its false online posts that the token would go as high as $60,000. The fake news, in the form of Forbes predictions, went viral on social media and falsely connected XRP to unrealistic price forecasts. These posts used exaggerated figures and emotional symbols to generate engagement and drive users toward unrelated promotional tokens.
The misleading campaign attempted to associate XRP with “REAL TOKEN,” which claims to operate on the XRP Ledger. The marketing language, combined with inflated numbers, created a false impression of institutional endorsement. Such tactics often blur the line between credible analysis and promotional hype in the cryptocurrency market.
No official statements or verified publications from Forbes support the $60,000 claim. The evidence instead points to coordinated social media promotion intended to exploit XRP’s credibility. Consequently, market participants have shifted focus back to technical data and price behavior rather than sensational headlines.
Market Structure and Technical Strength
XRP trades around $2.99 as momentum gradually strengthens after earlier volatility in 2025. The token shows signs of stabilization, with buying activity increasing near short-term resistance levels. Moving averages confirm an early realignment phase, with price action consistently closing above key technical supports.

Source: chart.ainvest.com
The 5-day and 12-day moving averages have crossed upward, indicating a developing bullish trend. This formation suggests that momentum could carry the asset toward the $3.20 to $3.40 resistance zone. The flattening 50-day average also signals stabilization, reducing the likelihood of another sharp correction.
Technical data now suggest a possible mid-cycle recovery phase as XRP transitions from consolidation to accumulation. The price stability near $3 reflects renewed market confidence and sustained participation from traders. As the market realigns, the potential for steady upward progress grows stronger.
Momentum Indicators Signal Improvement
The MACD indicator shows improving momentum with a positive crossover between the signal and MACD lines. The growing green histogram bars indicate strengthening upward pressure and the potential for a sustained short-term trend. This alignment often precedes measured price advances when trading volume remains consistent.
The histogram’s steady rise above zero supports the view of gradual and sustainable growth. It also reflects improved sentiment and reduced speculative volatility. These signals align with broader technical formations that suggest recovery rather than sudden surges.
In summary, XRP’s outlook appears stable and data-driven, contrasting sharply with viral false claims of extreme valuations. The market structure points toward a potential breakout above $3.00 if support near $2.90 holds. Current trends favor a constructive rebound into late 2025, grounded in fundamentals rather than speculation.


