- Shiba Inu’s Shibarium TVL increased from $734k to $1.86 million this month.
- Whale holdings of SHIB tokens surged from 23.7B to 105.9B since September.
- Shiba Inu price faces downside risks with technical indicators suggesting more decline.
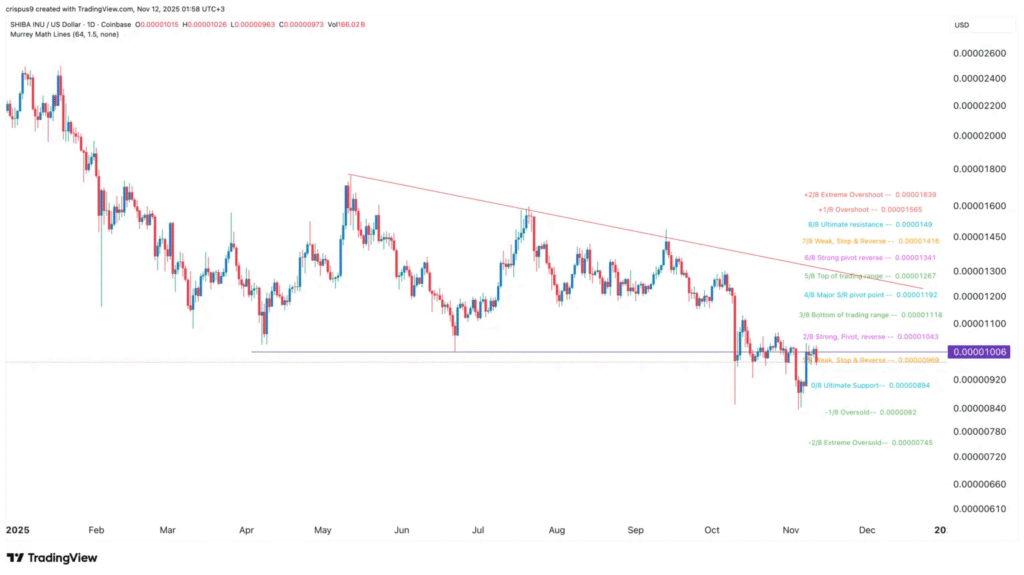
Shiba Inu (SHIB) has seen some notable improvements in its ecosystem, yet its price continues to face challenges. As of this week, the SHIB token was trading at $0.00000971, maintaining a range seen in recent days. Despite a promising outlook in terms of whale activity and ecosystem growth, Shiba Inu’s price struggles to break free from bearish market pressures.
Growing Activity in Shibarium and Whale Accumulation
One of the more positive trends surrounding Shiba Inu is the growing activity within its Shibarium network. According to DeFi Llama, the total value locked (TVL) on Shibarium has seen a significant increase, rising from a low of $734,840 to $1.86 million this month.
Additionally, other platforms within the Shiba Inu ecosystem, such as ShibaSwap and WoofSwap, have seen notable asset increases. ShibaSwap’s TVL has grown by 112% in the last 30 days, reaching $1.15 million.
Moreover, the supply of SHIB tokens on exchanges has been steadily decreasing. There are currently around 284.82 trillion tokens on exchanges, a decline from 302 trillion in July.
This reduction indicates that holders are less likely to sell their tokens, which could signal confidence in the token’s long-term prospects. Furthermore, whale activity has surged, with large holders now holding 105.9 billion SHIB tokens, a significant increase from 23.7 billion in September.
Bearish Technical Indicators Still Dominating
Despite these positive fundamental developments, Shiba Inu’s technical indicators remain bearish. The SHIB token is trading below the 50-day and 100-day Exponential Moving Averages, suggesting that bears are still in control of the market.
Additionally, the token is hovering near a key support level of $0.000010, which coincides with the lower side of a descending triangle pattern. This pattern is often viewed as a bearish continuation signal.

SHIB’s price has also dropped below important levels marked by the Murrey Math Lines, which suggests the price could face further declines. Technical analysis points to potential support near $0.0000082, which may become a key level for sellers to target in the coming days.
Disclaimer: This article is for informational purposes only and does not constitute financial advice. CoinCryptoNewz is not responsible for any losses incurred. Readers should do their own research before making financial decisions.


