- BNB broke above a descending trendline after holding support around $775.
- The price is approaching $900, near the upper Bollinger Band resistance.
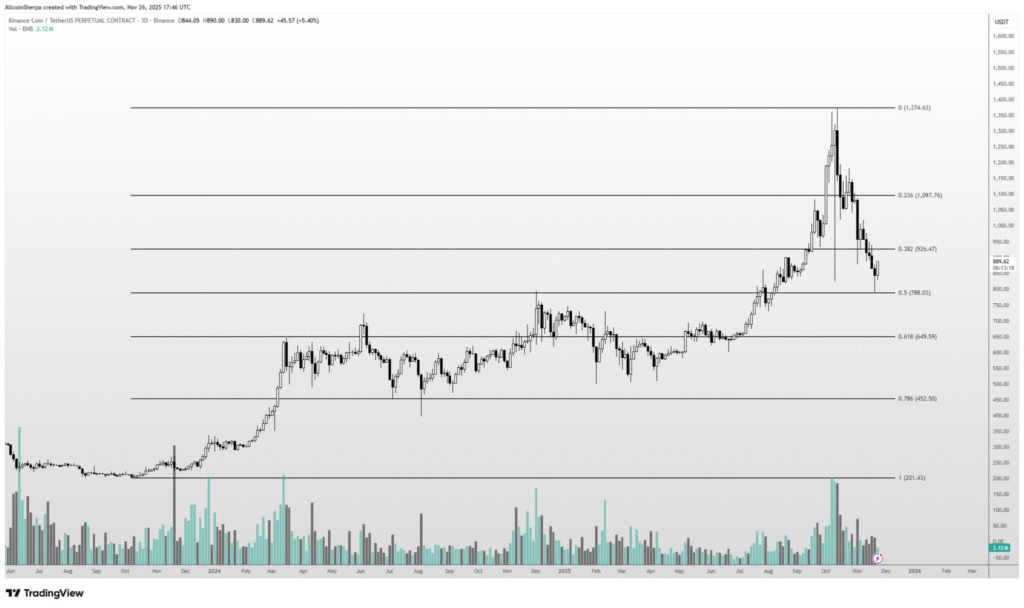
- BNB bounced from the 0.50 Fibonacci retracement level of its 2023–2025 rally.
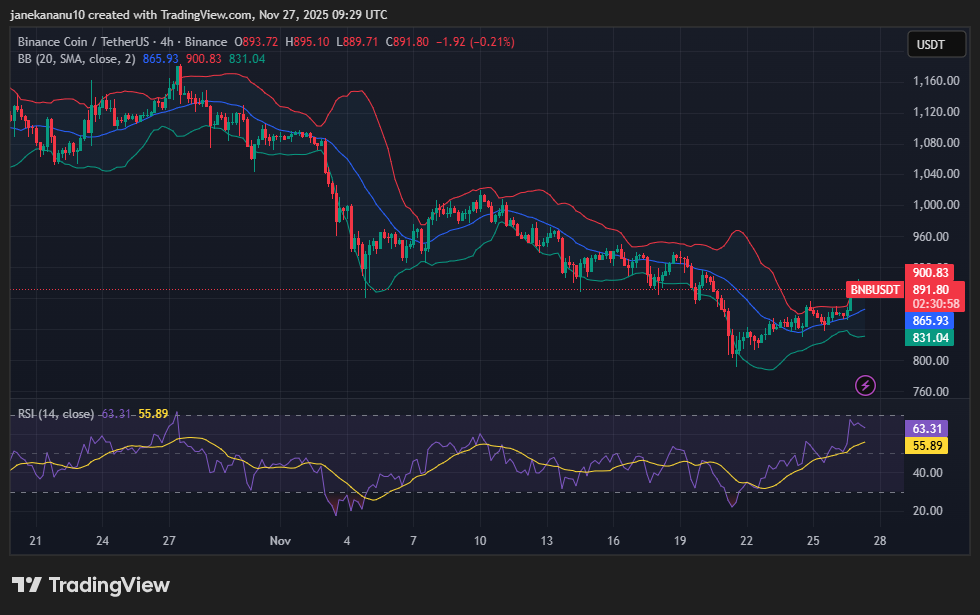
Binance Coin (BNB) is showing signs of a recovery after a prolonged downtrend. At Press time, BNB is trading at $891.80, slightly down by 0.21% in the 4-hour timeframe. This comes after the price rebounded from a low near the $775 support zone and broke out of a descending trendline.

Technical indicators are pointing to a possible continuation of this short-term bullish momentum. The Relative Strength Index (RSI) stands at 63.31, which is just below the overbought threshold of 70.
The RSI-based moving average is at 55.89, supporting the upward movement. Bollinger Bands show that the price is near the upper band at $900.83, a level that may act as resistance.
Key Support Zone Holding and Fibonacci Level Reached
Analyst Altcoin Sherpa noted on X (formerly Twitter) that BNB has touched the 0.50 Fibonacci retracement level of its rally since 2023. This level, near the $880 area, often acts as a medium-term support in trending markets. The bounce seen from this zone indicates buyers are attempting to regain control.

“BNB hit near the 0.50 fib of the entire rally since 2023; looks to be bouncing now,” Sherpa stated. He also added that Binance Coin remains one of the strongest major altcoins due to its connection to the Binance ecosystem.
While most altcoins follow Bitcoin’s trend, Sherpa believes BNB could hold better as long as Bitcoin remains stable. Volume activity around the bounce zone also shows increased participation, supporting the possibility of a further upward push.
Trendline Breakout Signals Shift in Short-Term Price Structure
Technical analyst Degen_Hardy observed a clear breakout above a descending trendline on the 4-hour chart. The trendline had acted as resistance throughout November. After a successful retest of the $775 support zone, the breakout may confirm a change in market structure.
Hardy mentioned, “BNB is actually looking very good here for bulls… if we break this trendline we could see a move higher.”
Since the breakout, price action has formed higher lows, which supports a bullish bias. As BNB nears the $900 resistance level, traders will be watching to see if it can sustain momentum and push through this key area.
Disclaimer: This article is for informational purposes only and does not constitute financial advice. CoinCryptoNewz is not responsible for any losses incurred. Readers should do their own research before making financial decisions.


