- Bitcoin’s MVRV Ratio remains below overvaluation, allowing further growth.
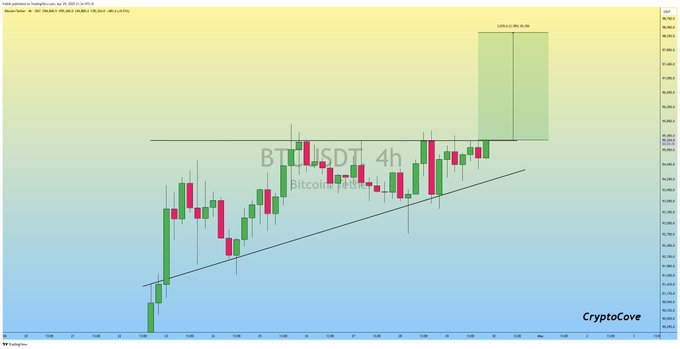
- Technical charts show an ascending triangle pattern targeting the $98,300 level.
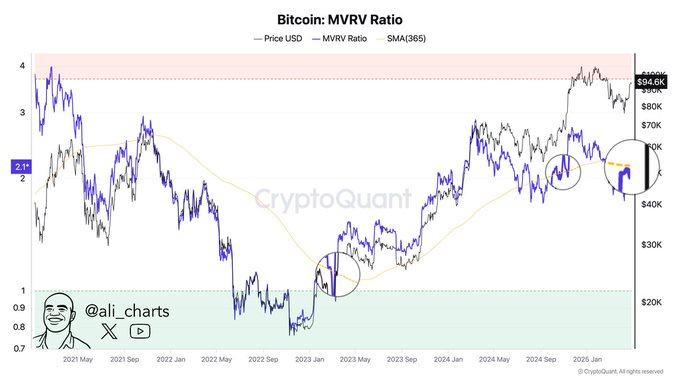
According to CryptoQuant, Bitcoin’s MVRV Ratio has crossed above its 365-day simple moving average (SMA), forming a golden cross. This move mirrors a similar pattern in January 2023 that preceded Bitcoin’s surge past $70,000 by early 2024. The MVRV Ratio now stands near 2.1, still below the overvaluation zone, suggesting room for growth.

The golden cross indicates that Bitcoin is valued above its average realized price over the past year. Analysts view this crossover as a potential precursor to a bullish phase. Bitcoin traded near $59,000 at the crossover, well below its current levels.
Technical Charts Suggest Breakout Toward $98,300
Captain Faibik’s analysis of Bitcoin’s 4-hour chart reveals an ascending triangle pattern, marked by higher lows and resistance around $78,000. The setup points to a potential breakout, with a target of approximately $98,300. Ascending triangles are considered bullish patterns, and price action suggests that Bitcoin may soon challenge upper resistance levels.

The support line has held consistently, and price action remains within the triangle’s bounds. A successful breakout above $78,000 could trigger further upward movement. However, a failure to breach resistance may result in temporary consolidation or pullback.
Valuation Models Show Bitcoin Trading Below Historical Peaks
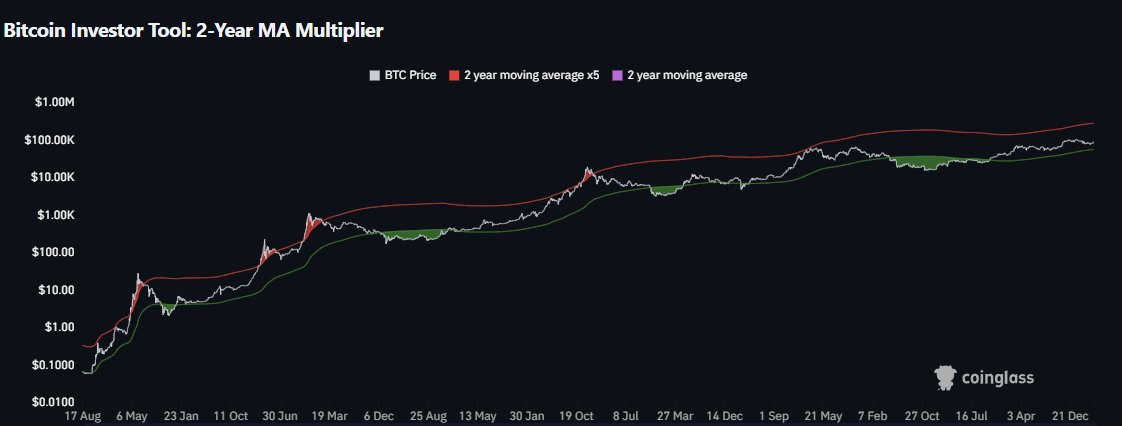
Analyst Daan Crypto Trades highlighted Bitcoin’s position within the 2-Year Moving Average Multiplier model, which is used to identify long-term valuation zones. The current price remains in the lower half of the range, well below the historical top band near $290,000. This model uses a 2-Year MA and a multiplier of five to indicate market tops and bottoms.

Bitcoin peaks after moving above the 2-Year MA x5 line, with the current position suggesting more room to grow. Daan emphasized that this tool is most effective when combined with other metrics. Current alignment across multiple indicators supports the potential for upward price movement.
Bitcoin Trading in Ascending Channel, Key Levels to Watch
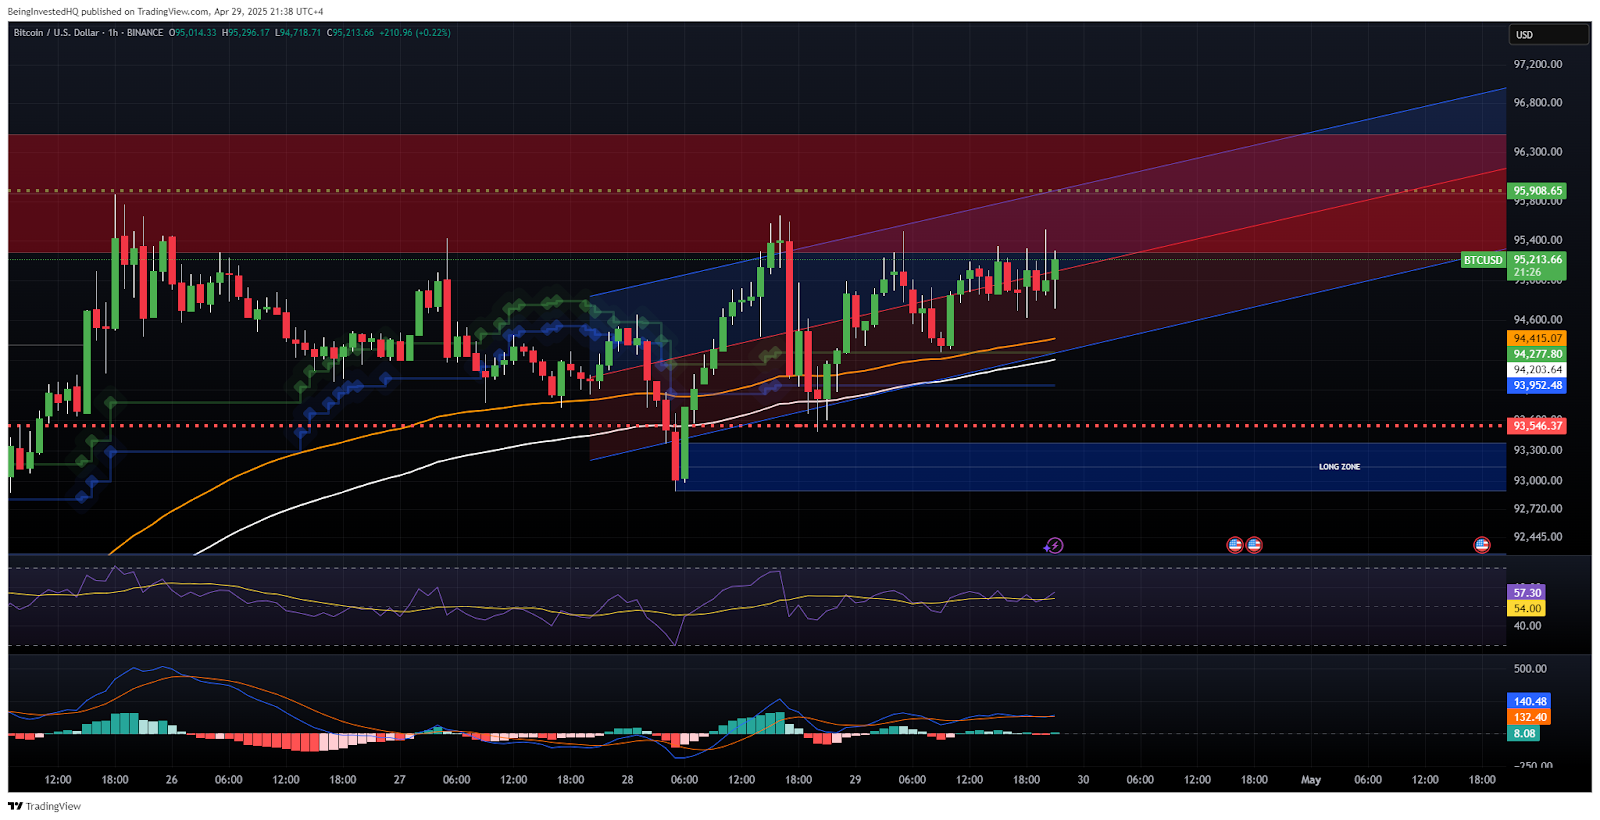
Bitcoin currently trades at $95,213.66, showing consolidation within an ascending channel. The price has fluctuated between support at $93,952 and resistance at $95,908, with significant momentum above key moving averages, including the 50-period (orange) and 200-period (white) MA.

The RSI stands at 57.30, indicating neutral momentum, while the MACD shows positive signals, suggesting the potential for further upward movement. Bitcoin targets a breakout above $95,900, with the next resistance near $96,300. A failure to break resistance could see the price test lower support levels around $93,300 and $92,445. Watch these levels closely for potential price action.
Standard Chartered’s Geoff Kendrick projected Bitcoin to reach $120,000 in Q2 2025 and $200,000 by year-end. He cited institutional demand, ETF inflows, and stablecoin regulation as key drivers. These forecasts align with ongoing trends of increased market participation and regulatory developments.
Disclaimer: This article is for informational purposes only and does not constitute financial advice. CoinCryptoNewz is not responsible for any losses incurred. Readers should do their own research before making financial decisions.


