Polkadot Dips Further as Bearish Momentum Escalates

Polkadot has broken below key support levels with a 6.01% price drop, as bears dominate the market and could face historic lows.

Polkadot has maintained a bearish price action as selling pressure rises in the market. DOT is trading at $3.28 at press time, per CoinMarketCap data. The coin’s trading volume has surged 6% as the price drops, signalling that most traders in the market are selling DOT, and the price could drop further.

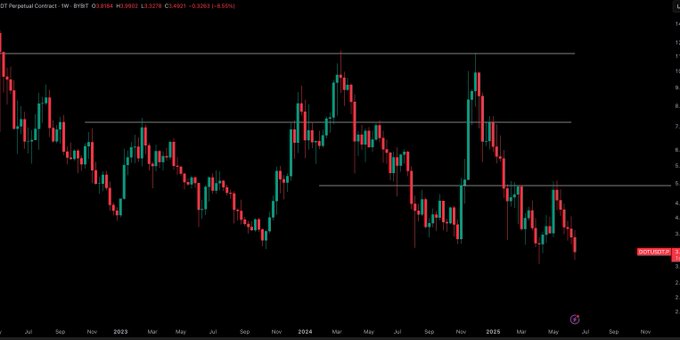
Looking at the weekly chart, DOT has been forming lower lows continuously, suggesting a strong downtrend momentum in the past few weeks. The coin has turned the $4.50 support into a key resistance zone after breaking below it. Polkadot has broken several key support zones on its bearish rally and could struggle to break above them if the trend reverses.
Source: X

So, where are the key levels to watch for?

If Polkadot fails above the $3.00 key support level, the next major resistance zone is at the $2.50-$2.00 range. The are historical lows, lastly seen during the 2022 bearish cycle. If bulls step in above the $3.00 key support, a trend reversal could see DOT attempt to reclaim the $4.5 key resistance zone.

However, with the strong bearish momentum, a strong volume and change in market sentiment will be required for a sustainable rally to attempt a break above this level. The coin’s MACD and smooth moving averages signal a “strong sell”. DOT’s open interest has dipped, showing the market sentiment remains bearish above the 3.00 support. Traders are monitoring DOT’s behaviour around this zone for further insights.

Disclaimer: This article is for informational purposes only and does not constitute financial advice. CoinCryptoNewz is not responsible for any losses incurred. Readers should do their own research before making financial decisions.

Hot this week

Stellar (XLM) Poised for Breakout: Key Insights

XLM hovers near $0.413 resistance, needing one more high...

Bitcoin Bull Score Hits 80: Historic Rally Ahead?

Bitcoin’s Bull Score reaches 80, signaling strong bullish conditions. Price...

From Bitcoin to Ethereum: Market Rotation Accelerates Ahead of Potential New ETH All-Time High

Ethereum’s rally above $4,500 and a falling BTC-to-ETH ratio confirm growing dominance, signaling Altseason’s arrival and a new crypto market cycle.

Ethereum Breaks $4,500 Resistance, Altseason Looms as Macro Liquidity Returns

Ethereum breaks $4,500, mirroring the Russell 2000’s breakout as risk-on sentiment rises, fueling expectations for a new Altseason and market expansion.

ETH Supply at Record Lows – Is a Major Rally Next?

Ethereum is flashing one of its most reliable historical...

Topics

Stellar (XLM) Poised for Breakout: Key Insights

XLM hovers near $0.413 resistance, needing one more high...

Bitcoin Bull Score Hits 80: Historic Rally Ahead?

Bitcoin’s Bull Score reaches 80, signaling strong bullish conditions. Price...

From Bitcoin to Ethereum: Market Rotation Accelerates Ahead of Potential New ETH All-Time High

Ethereum’s rally above $4,500 and a falling BTC-to-ETH ratio confirm growing dominance, signaling Altseason’s arrival and a new crypto market cycle.

Ethereum Breaks $4,500 Resistance, Altseason Looms as Macro Liquidity Returns

Ethereum breaks $4,500, mirroring the Russell 2000’s breakout as risk-on sentiment rises, fueling expectations for a new Altseason and market expansion.

ETH Supply at Record Lows – Is a Major Rally Next?

Ethereum is flashing one of its most reliable historical...

Cardano Breaks Resistance at $0.87, $1 Rally Expected Soon

Cardano ($ADA) surges to $0.87 as Bitcoin breaks ATH,...

Solana Price Could Dip to $210 Before Breaking Its ATH Record

Solana ($SOL) could revisit $210 before aiming for a...
spot_img

Related Articles

Popular Categories

spot_imgspot_img