- ADA’s bullish reversal gains traction as respected order blocks and a Market Structure Shift (MSS) confirm strong demand zones.
- Liquidity pool near $1.175 acts as a price magnet, with short-term resistance at $0.93–$0.95 defining breakout potential.
- Daily and harmonic patterns reinforce buyer control, showing steady accumulation and upside momentum despite prior consolidation.
Cardano (ADA) displayed renewed bullish momentum as technical structures aligned to favor buyers. The token gained strength from demand confirmation and structural shifts. Price action pointed toward higher levels, with a liquidity pool at $1.175 acting as a potential upside target.
ADA’s chart highlighted an important order block that remained intact after a liquidity sweep. This confirmed demand and neutralized downward attempts. Sellers failed to extend pressure, while buyers absorbed supply to establish a reliable support base.
The respected order block validated ADA’s underlying strength. It created a foundation that could drive consistent upside movement in the near term. This zone marked a critical level where buyers reinforced control.
Bullish Signals from Breaker Block and BOS
ADA’s setup featured a breaker block and a Break of Structure (BOS), both signaling bullish intent. These markers shifted the token from reactive phases into assertive upward movement. Market structure now leaned toward short-term buyer control.
The breaker block suggested regained strength. Meanwhile, BOS confirmed expansion beyond prior ranges. Together, these elements created confidence that ADA’s near-term outlook aligned with upward targets.
Such structural markers showed increased conviction. Buyers now dictated direction. The setup positioned ADA for further gains, with immediate sentiment reflecting sustained bullish preference.
Upside Targets and Market Structure Shift
The chart displayed a liquidity pool near $1.175, acting as an upside magnet. This provided a key target for continuation. The Market Structure Shift (MSS) further reinforced reversal bias.

Source: Binance
MSS highlighted transition from bearish phases into bullish alignment. It emphasized ADA’s readiness to progress toward higher value zones. This alignment built confidence in sustained expansion.
If momentum persisted, ADA could advance into the liquidity cluster. Such a move would stimulate additional participation. Price dynamics pointed toward higher upside probability.
Daily and Short-Term Perspectives
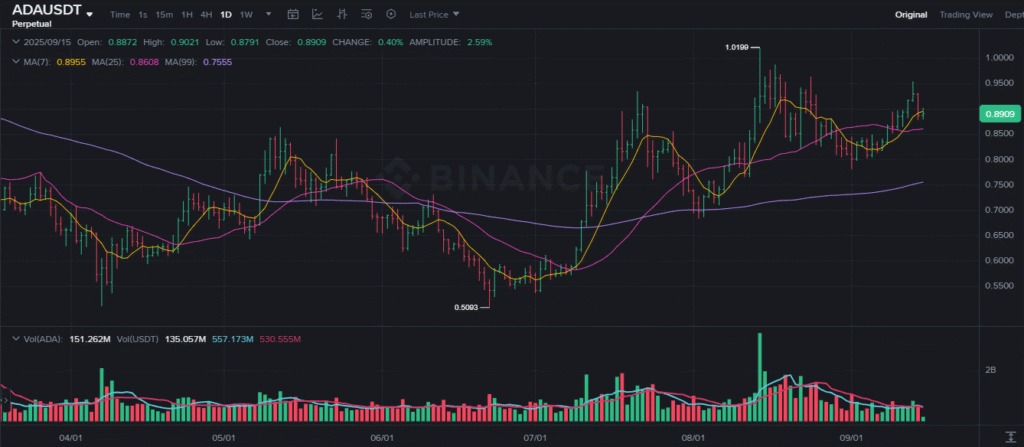
On the daily timeframe, ADA recovered strongly from $0.5093 to above $0.8909. It maintained levels above the 25-day and 99-day moving averages. This structure confirmed mid-term and long-term support.

Source: Tradingview
Volume trends showed periodic spikes, signaling accumulation phases. Rallies built on strong participation, while consolidations reflected stable rebalancing. Market structure aligned with gradual expansion.
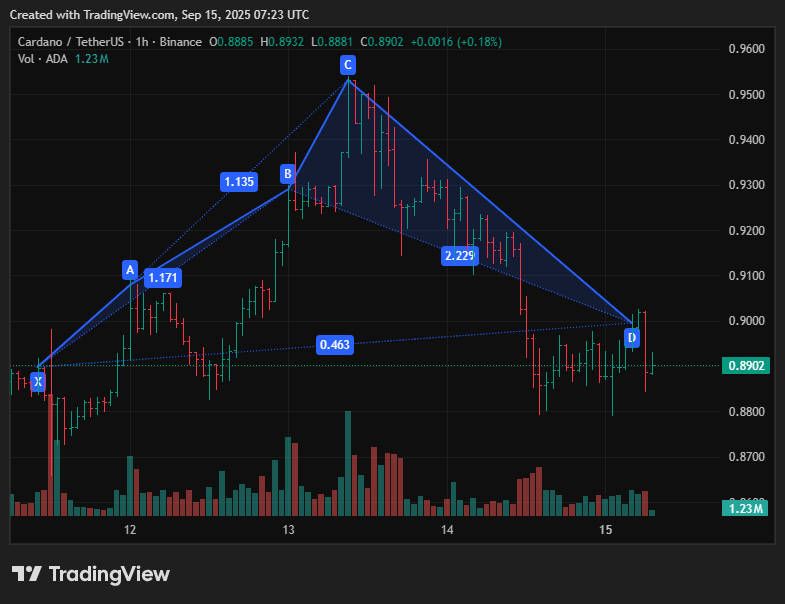
In the short term, a harmonic pattern indicated stabilization near $0.89. Support held firm, while resistance capped upside near $0.93–$0.95. A break could unlock the $1.00 level.
Disclaimer: This article is for informational purposes only and does not constitute financial advice. CoinCryptoNewz is not responsible for any losses incurred. Readers should do their own research before making financial decisions.


