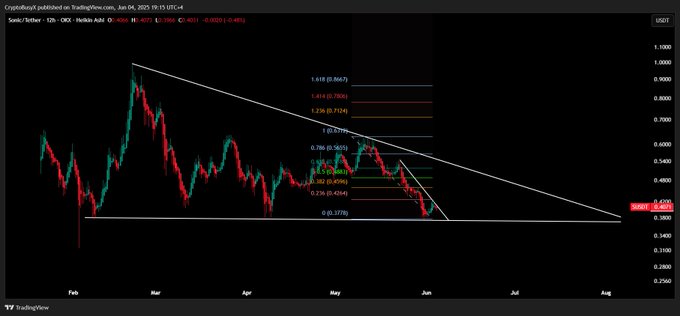
SonicLabs (S) flashes signs of a bullish breakout following weeks of price consolidation inside a descending triangle. What’s next?
Sonic has faced weeks of bearish pressure with its price making lower highs and lower lows. Sonic’s price has decreased by 3.43% over the past 24 hours, according to CoinMarketCap. However, the bulls appear to take charge, beginning a price reversal with a 7.11% surge in trading volume, at press time.
A Look into Sonic’s Technical Setup
Sonic’s technical setup reveals signs of a price bounceback. Looking at the 12-hour chart, the price has been consolidating in a descending triangle pattern, with the price testing a key support zone. Additionally, Fibonacci retracement levels reveal the $0.38 zone as a key support level.

If the bulls push above the descending trendline, the next targets could be $0.65, $0.72, and $0.86. A clean breakout above this descending triangle with substantial volume could begin Sonic’s rally in the coming days. On the contrary, if the coin fails to hold above the $0.38 zone, it could lead to further downside after breaching the support.
The 24-hour Relative Strength Index (RSI) stands at 38, an oversold zone. This is indicative of more buying potential if Sonic begins its price uptrend. Traders are watching Sonic’s next move around the $0.38 support zone for further insights.


