- Liquidity remains high, with SSR in the lower blue band.
- Binance shows the highest leverage concentration near the $93,748 level.
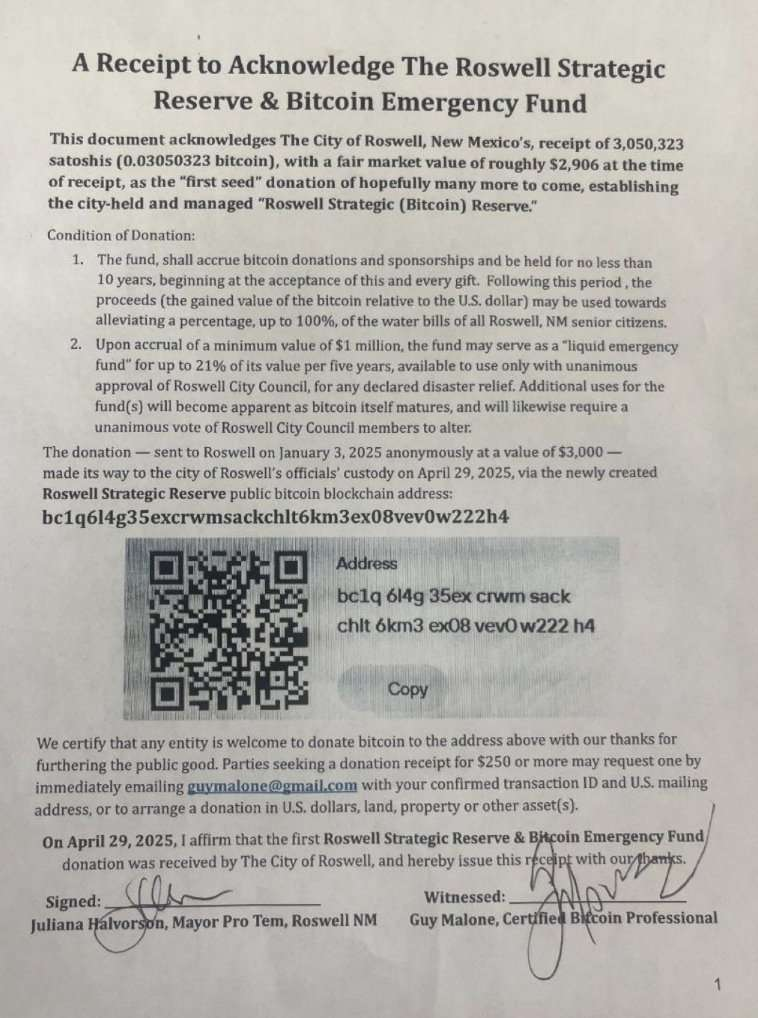
Bitcoin is trading near $96,000 after a brief pullback from its 24-hour high of $95,320. The asset has gained 1.03% in the last 24 hours. Technical indicators suggest strong bullish momentum supported by rising liquidity and a concentration of leveraged positions. Meanwhile, Roswell, New Mexico, has launched a Bitcoin reserve, becoming the first U.S. city to integrate BTC into its finances.
Stablecoin Supply Ratio Signals Liquidity Readiness
Bitcoin’s Stablecoin Supply Ratio (SSR), calculated by dividing BTC’s market cap by the stablecoin market cap and smoothed using a 200-day average, is currently within the lower blue band.
This metric indicates that liquidity remains high and could be deployed into the market. Top analysts Darkfost observing this trend noted that while the SSR is rising, it hasn’t yet entered the “cool zone,” a range that signals strong re-entry of capital.
Source: Alphractal
Alphractal Chart data shows that low volatility dominates, allowing participants to buy minor dips. If fear of missing out (FOMO) intensifies, the available liquidity may trigger a price rally. However, traders monitor the red band, the “heated zone” where overcapitalization historically leads to sharp corrections.
Leverage Concentrates Around $93,748 Price Level.
According to CoinAnk data, leverage surges as Bitcoin trades near $93,748. Liquidity distribution across Binance, Bybit, and Okex shows a concentration of open positions, with Binance holding the majority. The orange curve in the Binance chart reveals a spike in leveraged trading volume as Bitcoin edges closer to this price point.
Source: Coinank
Bybit and Okex show smaller positions, but the data suggests growing pressure across all platforms. Analysts warn that such heavy leverage buildup increases the chance of a liquidation cascade if Bitcoin fails to hold support.
A sharp price rejection at this level could amplify downside volatility. This setup reflects a fragile balance between bullish momentum and market overexposure, particularly through derivative trading channels.
Price Patterns Confirm Bullish Momentum as Roswell Joins Bitcoin Adoption
Bitcoin has broken through several resistance levels since late April. The asset is now moving inside an ascending channel, supported by an upward-sloping trendline. Key patterns include a symmetrical triangle formed between April 4 and 16, and a descending channel between April 19 and 23. Both signaled consolidation before a bullish breakout.
Source: TradingView
The current support level remains firm, providing structure for further upside. Analysts point to the $92,000 to $94,000 zone as a decisive area. A clean break above this range could open the door to higher highs in May.
Meanwhile, Roswell, New Mexico, received 3,050,323 satoshis, or about $2,906, as a donation to form a Bitcoin fund. Named the “Roswell Strategic Bitcoin Reserve,” the fund will be held for 10 years.

The city plans to use it to support utility payments or emergency funding needs. Roswell’s move could influence future municipal strategies involving digital assets.
Disclaimer: This article is for informational purposes only and does not constitute financial advice. CoinCryptoNewz is not responsible for any losses incurred. Readers should do their own research before making financial decisions.


