- Chainlink experiences heightened sell volume and weakening price action, signaling a clear shift in short-term momentum across major sessions.
- The token tests a long-standing trendline that supported its climb since 2023, raising uncertainty as recent selling grows stronger.
- Chainlink’s direction depends on whether the support holds, which could spark a rebound or trigger a slide toward lower historical levels.
Chainlink moves into a challenging phase as rising sell volume and declining price action reshape its short-term outlook. The token trades lower while market data signals growing pressure near key levels. The shift creates new questions about stability because recent momentum now weakens across major sessions.
Chainlink’s Short-Term Struggles: What High Volume and Falling Prices Tell Us
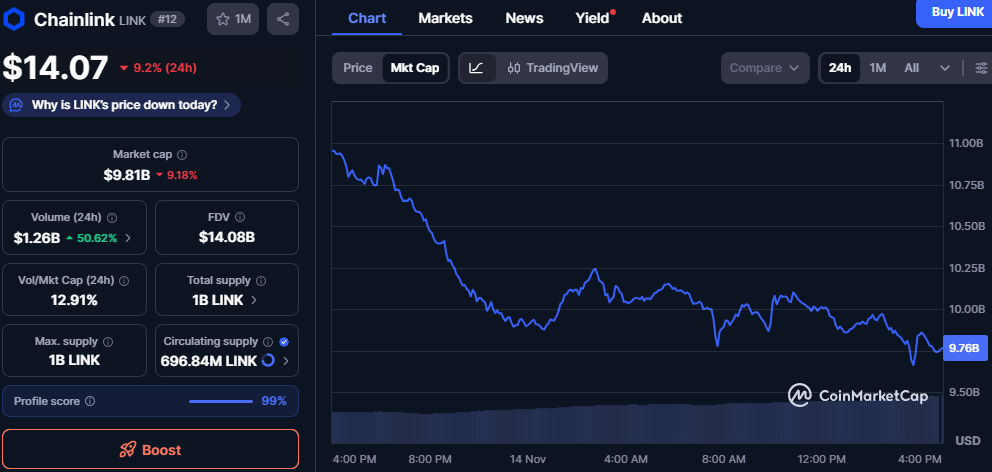
Chainlink records a sharp daily decline as its price falls and trading activity increases across major exchanges. The latest session shows a clear downtrend because consistent selling drives the chart lower. The pattern forms a notable contrast with the steady growth that Chainlink displayed earlier in the year.
Chainlink also posts a significant volume jump as 24-hour activity rises well above its prior levels. The stronger turnover signals heavy participation because large orders continue to shape intraday moves. The trend also suggests broader market pressure as multiple assets react to shifting conditions.
Chainlink shows a firm connection between price movement and market cap because both metrics fall at nearly the same pace. The alignment indicates that the drop reflects immediate market activity rather than structural change. The pattern still highlights weakening sentiment as the token approaches recent support areas.
Support Trendline Test Raises New Short-Term Questions for Chainlink
Chainlink moves toward a long-standing support trendline that formed during its extended climb from mid-2023. The price has respected this line during past declines because buying strength often emerged at similar points. The current movement now tests this trendline again as the token trades near recent lows.

Source: CoinMarketcap
Chainlink historically bounced from this region as earlier touches produced strong upward follow-through. The chart shows repeated reactions along the line because the level acted as a steady technical anchor. The latest retest creates uncertainty because recent selling appears stronger than previous episodes.
Chainlink may shift direction depending on how this trendline reacts to continued pressure. A hold could push price toward earlier resistance zones as momentum attempts to rebuild. A break may open a path toward lower supports as the market reacts to the weakened structure.
Potential Paths Ahead as Chainlink Extends Its Slide
Chainlink could rebound if current support stabilizes and short-term activity cools across major trading periods. The token may then target earlier mid-range levels because prior rallies developed from similar conditions. The move would mirror earlier phases as recovery patterns formed after strong declines.
Chainlink could also face deeper pressure if the trendline loses strength during extended selling. The next support region may appear near historical range levels that held during previous downturns. The setup would reflect a broader shift as the token adjusts to changed market conditions.
Chainlink remains active across markets as volume continues to guide near-term direction. The token now sits at a crucial point because both momentum and structure influence its path. The coming sessions will determine whether strength returns or the decline continues.
Disclaimer: This article is for informational purposes only and does not constitute financial advice. CoinCryptoNewz is not responsible for any losses incurred. Readers should do their own research before making financial decisions.


