Ethereum (ETH), the world’s second-largest cryptocurrency by market capitalization, is once again at a critical juncture. On June 4, 2025, crypto analyst Captain Faibik (@CryptoFaibik) shared a detailed technical analysis on X (formerly Twitter), pointing to a multi-year symmetrical triangle formation that ETH has been consolidating within since early 2021.
As the asset nears the apex of this formation, analysts believe a decisive breakout could be just weeks away—with bullish projections aiming as high as $12,000 in the long term.
The Symmetrical Triangle: Calm Before the Storm?
A symmetrical triangle pattern typically forms when price action converges between two trendlines—one descending and one ascending—indicating indecision between bulls and bears. According to Investopedia, this setup usually precedes a significant breakout in either direction, depending on prevailing sentiment and volume confirmation.
Captain Faibik’s chart, sourced via CryptoCove, shows Ethereum’s price nearing the triangle’s apex, suggesting a breakout may occur within the next 1 to 2 months. The analyst notes that a monthly close above $3,500 would validate a bullish breakout, setting the stage for a potential rally toward his target of $12,000.
Ethereum’s Current Market Standing
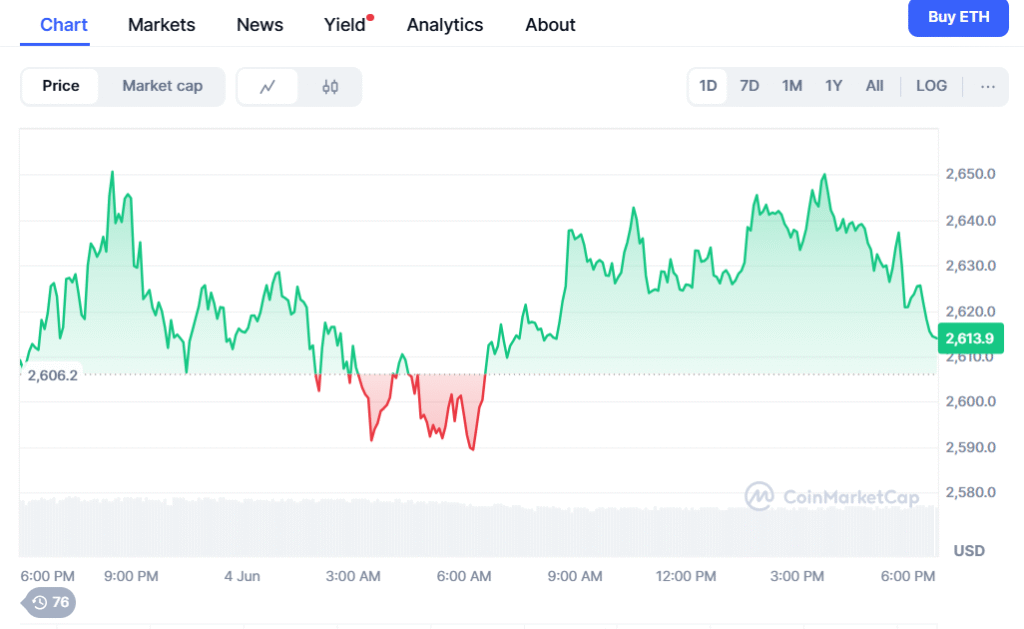
As of CoinMarketCap data confirms Ethereum’s continued relevance and market dominance. Although daily prices fluctuate, ETH has demonstrated resilience amid market volatility. Its historical trend of leading broader crypto market movements—whether upward or downward—remains firmly intact.

Changelly’s latest forecast supports a bullish long-term perspective, predicting Ethereum could reach $7,000 within five years. Some analysts, echoing Faibik’s views, believe Ethereum could even outperform these estimates, especially if institutional adoption, Layer 2 scaling, and Ethereum 2.0 developments accelerate.
A Window of Opportunity for Accumulation?
Faibik emphasizes that the current consolidation phase presents a strategic accumulation opportunity. His message to followers—“Once the train slips out of your hand, it won’t come back”—underscores the urgency many traders feel as Ethereum inches closer to a potential breakout point. However, he also warns investors to remain cautious of false breakouts, a common pitfall in symmetrical triangle setups. Volume spikes or retests of the breakout trendline are typically used to confirm a legitimate move.
Macro Factors to Watch
Beyond technical charts, macroeconomic headwinds could influence Ethereum’s short-term performance. A recent CoinShares report outlines how newly imposed U.S. tariffs may contribute to inflationary pressure and dampen economic growth, which traditionally weighs on risk assets. However, Bitcoin and Ethereum have increasingly been viewed as hedges against long-term financial instability, providing potential upside in uncertain environments.
Community Sentiment and Market Momentum
Faibik’s analysis has sparked conversation within the crypto community. Notably, user @crynetio dubbed the symmetrical triangle pattern “Schrödinger’s chart,” highlighting its unpredictable nature until confirmed. Others lauded Faibik’s precise technical breakdown and bullish conviction.
Whether Ethereum breaks to the upside or faces a temporary retracement, its current position within this multi-year structure marks a pivotal moment. A sustained move above $3,500 could shift market sentiment and renew institutional interest, potentially making Ethereum the pace-setter for the crypto market through the second half of 2025.
Conclusion
Ethereum is standing at the edge of a major technical breakout, with signs pointing toward a bullish trajectory—if confirmed. As the symmetrical triangle tightens, traders and long-term investors alike are watching closely. With a potential move to $12,000 on the horizon, this could be Ethereum’s next defining chapter in crypto history.


