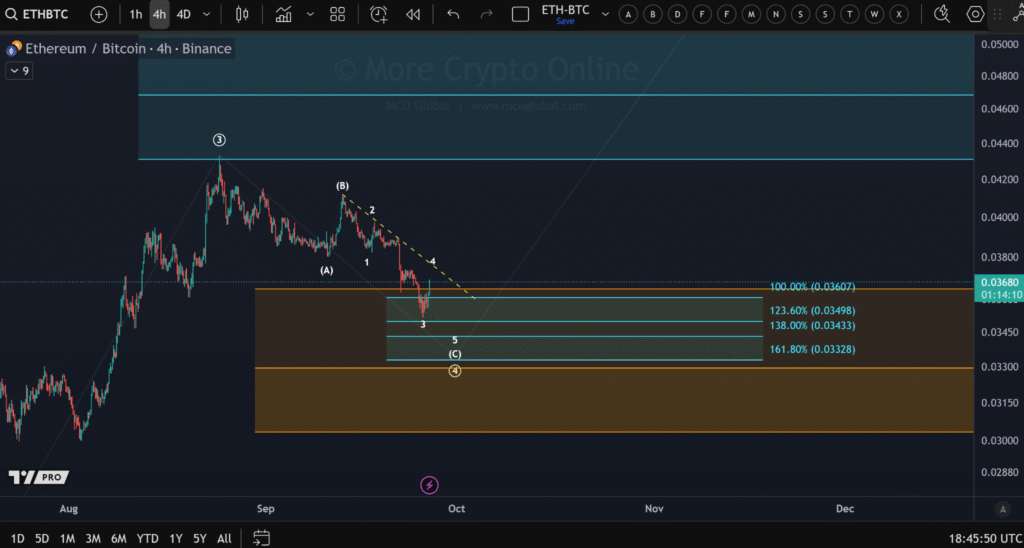
- ETH/BTC shows key support levels between 0.0336 and 0.0319 for potential reversal.
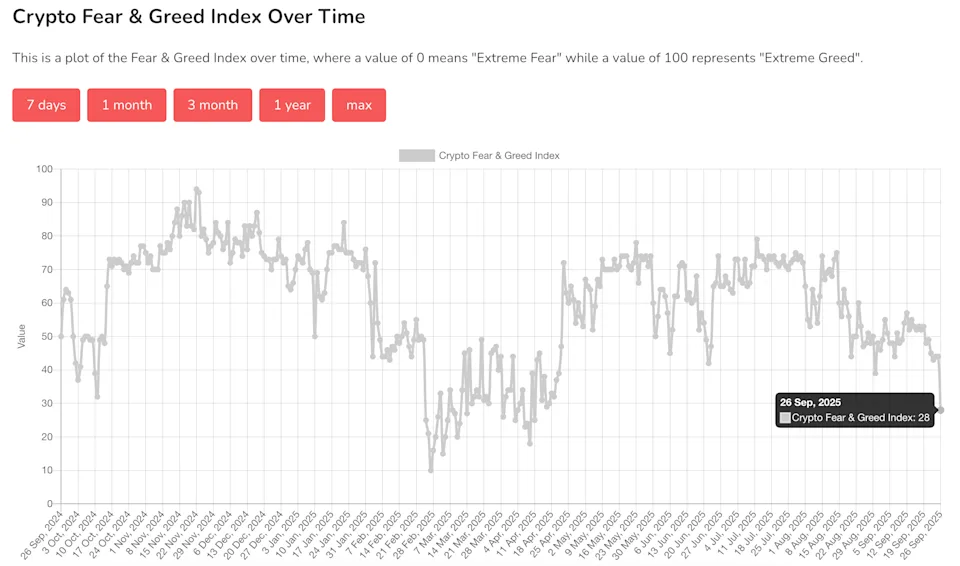
- Crypto Fear & Greed Index hits 28, signaling increased market fear after $3B liquidations.
- ETH/BTC chart points to critical Fibonacci retracement levels with ongoing bearish trends.
Ethereum’s price is currently reacting to a key target zone, located between the 0.0336 and 0.0319 levels on the ETH/BTC chart. The analysis, based on a 4-hour timeframe on Binance, shows a clear Elliott Wave structure, highlighting waves (A) and (B).
This pattern suggests that Ethereum is nearing a critical turning point, where further price movement could either indicate a reversal or continuation of its downward trend against Bitcoin.

The Fibonacci retracement levels also significantly contribute to identifying potential support zones for Ethereum. Levels at 12.3% (0.0349), 23.6% (0.0334), and 161.8% (0.0332) may act as critical support points.
Traders are closely watching these levels for signs of price stability or further decline. If Ethereum fails to hold these levels, the downtrend could extend, pushing prices toward lower ranges.
Crypto Sentiment Hits Fear Zone
The overall sentiment in the cryptocurrency market has turned increasingly fearful, with the Fear & Greed Index dropping to 28 on Friday. This is the lowest reading since mid-April, reflecting growing concerns among traders about the market’s direction.

The shift to fear comes after a recent wave of $1.1 billion in leveraged long position liquidations. As a result, market participants are cautious, and liquidity remains tight.
Matt Mena, a strategist at digital asset manager 21Shares, noted that roughly $3 billion worth of leveraged long positions have been wiped out in recent days.
This liquidation wave has led to an extreme bearish positioning, with popular tokens such as Bitcoin (BTC), Solana (SOL), and Dogecoin (DOGE) showing a long-to-short ratio of just one-to-nine. This sharp imbalance suggests traders are preparing for further downside.
Impact of Liquidations on the Market
The liquidation of leveraged positions has added to the pressure on the market, exacerbating the negative sentiment. While the excess leverage has mainly been flushed out, it has left behind an uncertain market environment.
The reduced long-to-short ratio and the Fear & Greed Index in the fear zone indicate that many traders are now expecting further downside in the coming weeks. This cautious outlook is putting additional strain on assets like Ethereum, which are still reacting to critical price levels.
Disclaimer: This article is for informational purposes only and does not constitute financial advice. CoinCryptoNewz is not responsible for any losses incurred. Readers should do their own research before making financial decisions.


