- Ethereum ETF inflows have surged from $2.2B in April to $13.62B in August.
- ETH mimics 2020 price pattern nears $3K–$4K zone, forming a V-bottom.
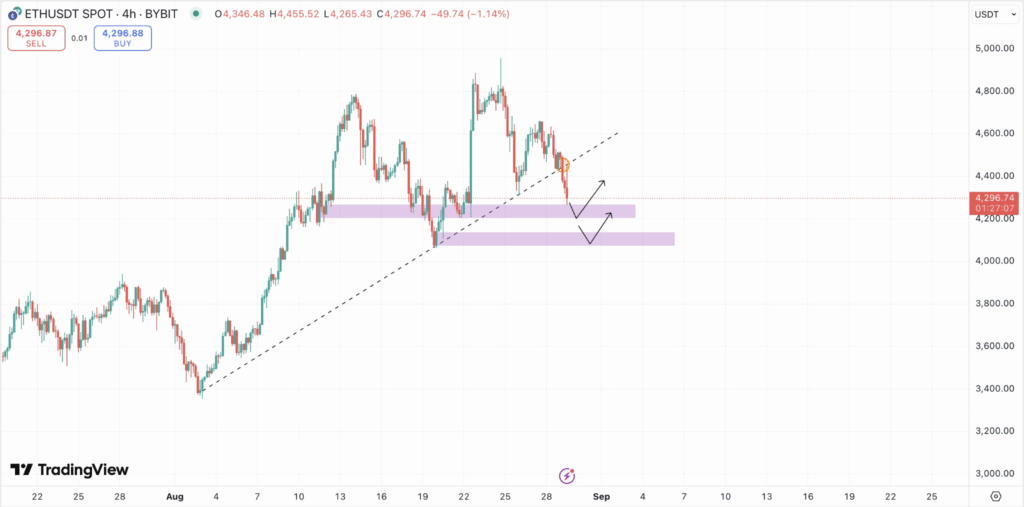
- ETH price holds $4,100–$4,200 support after breaking below the trendline.
Ethereum’s price movement is reflecting a structure previously observed during the 2019–2020 market cycle. A recurring “V-bottom” formation followed by a horizontal consolidation, often termed a “launchpad,” was seen near the $300 level before ETH surged to all-time highs.
A similar structure is currently taking shape between the $3,000 and $4,000 levels. On the weekly chart, Ethereum has formed another V-bottom with horizontal resistance building just above $4,000. This setup, based on historical patterns, may indicate early positioning for another breakout if demand continues to build.
ETF Inflows Cross $13.6 Billion as Institutions Increase Exposure
Ethereum exchange-traded funds (ETFs) have seen substantial capital inflows, particularly over the past two months. According to Bloomberg Intelligence, cumulative ETF inflows have grown from $2.20 billion in April to $13.62 billion by late August.
After initial outflows in August and September 2024 totalling $0.69 billion and $0.55 billion, respectively, capital started entering consistently. Key inflow milestones include $3.18 billion by December 2024 and $12.71 billion in early August 2025. This increase reflects a rise in institutional participation as investor sentiment around Ethereum improves.
Price Holds Above $4,100 Support as Bulls Eye Recovery
Ethereum is holding above a key demand zone between $4,100 and $4,200. The price broke below a short-term ascending trendline earlier this week, signaling temporary weakness. However, it has not yet lost the highlighted support zone.

This area has acted as a base for buyers in recent trading sessions. If ETH maintains this level, analysts expect a bounce toward the $4,400 region.
Failure to hold this zone, however, could lead to a further pullback. The chart shows two probable paths: a retest and rebound or a continuation lower before a recovery attempt.
Disclaimer: This article is for informational purposes only and does not constitute financial advice. CoinCryptoNewz is not responsible for any losses incurred. Readers should do their own research before making financial decisions.


