FLOKI at the Edge: Traders Watch out for THESE Key Levels

FLOKI is at a critical support range and holding the $0.00007700 could trigger a bullish rally. Will the bulls hold?

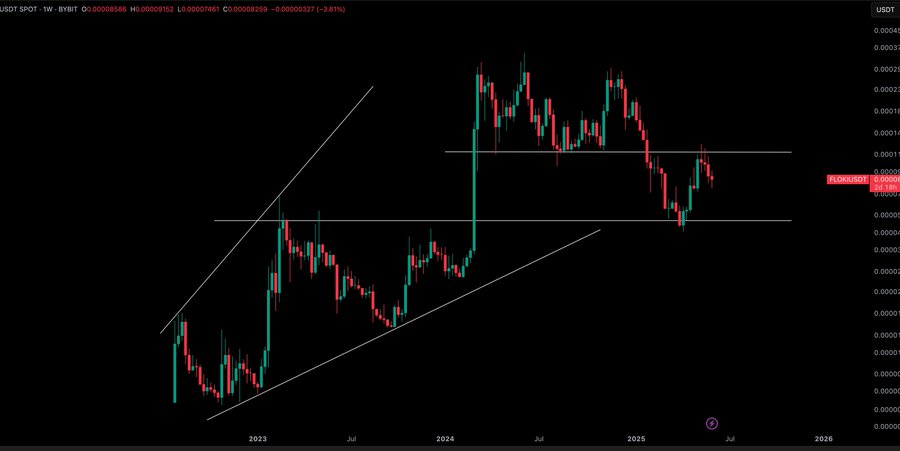
FLOKI is currently testing a key support level within a historical price range, with its current price action suggesting a corrective rally ahead. However, the meme coin needs to maintain the $0.00007700 key support zone.

Technical Setup

A look into FLOKI’s technical setup on the 1-week chart reveals a breakout from an ascending wedge pattern, followed by a strong rally in early 2024. The price consolidated for weeks before breaking below the 0.00011 key support zone. Following the breakdown, FLOKI is testing the 0.00011-0.000050 support zone with price fluctuating around 0.000077.
floki
Source: X

What’s next for FLOKI?

In lower timeframes, the $0.00007700 key support is historically significant for the memecoin’s next move. According to analyst Crypto Tony on X(formerly Twitter), bulls will need to hold this support zone to avoid a plunge to lower levels. If they fail to hold the memecoin at the $0.00007740, $0.00005200 could be FLOKI’s next support zone in the mid-term, before attempting another price uptrend.

As a result, the $0.00007740 remains essential in determining the memecoin’s next move. If the bulls hold and push above with high volume, FLOKI could be poised for a rally testing the $0.0001100, a key resistance zone in the next few weeks.

Disclaimer: This article is for informational purposes only and does not constitute financial advice. CoinCryptoNewz is not responsible for any losses incurred. Readers should do their own research before making financial decisions.

Hot this week

Grayscale’s Zcash ETF Filing Sends Privacy Coins Into Spotlight

Grayscale files SEC paperwork to convert GDLC Zcash Trust...

ADA Price Analysis: Cardano Eyes $0.50 Rebound After Gaining 7% This Week

ADA is trading around $0.43 after rising nearly 7%...

VET Shows Early Bottom Signals as High-Wave Candle Sparks Market Debate

VET shows early bottoming signs as a high-wave candle, rising volume, and firm support levels highlight growing strength across the market and signal a potential trend shift.

XLM Gains Over 7% as Price Tests Breakout Resistance Near 0.25

XLM forms a falling wedge pattern with strong historical...

Pi Consolidates Near $0.25 With Growing Strength Against Market Volatility

Pi holds steady near $0.25 as volume rises, market structure strengthens, and support levels remain firm, signaling stable momentum amid broader market volatility.

Topics

Grayscale’s Zcash ETF Filing Sends Privacy Coins Into Spotlight

Grayscale files SEC paperwork to convert GDLC Zcash Trust...

VET Shows Early Bottom Signals as High-Wave Candle Sparks Market Debate

VET shows early bottoming signs as a high-wave candle, rising volume, and firm support levels highlight growing strength across the market and signal a potential trend shift.

XLM Gains Over 7% as Price Tests Breakout Resistance Near 0.25

XLM forms a falling wedge pattern with strong historical...

Pi Consolidates Near $0.25 With Growing Strength Against Market Volatility

Pi holds steady near $0.25 as volume rises, market structure strengthens, and support levels remain firm, signaling stable momentum amid broader market volatility.

BNB Approaches $900 Resistance After Hitting 0.50 Fibonacci Retracement

BNB broke above a descending trendline after holding support...

Kaspa Nears Full Coin Emission as Market Cap Tops $1.6B in 24-Hour Spike

Kaspa surges above $1.6B market cap as strong price action, rising volume, and improving technical signals boost momentum while its near-complete emission strengthens long-term market positioning.

Powerful Bitcoin Reset: 3 Bullish Signals Behind the Massive OI Crash

Bitcoin’s open interest plunges 20% to $30B — the...
spot_img

Related Articles

Popular Categories

spot_imgspot_img