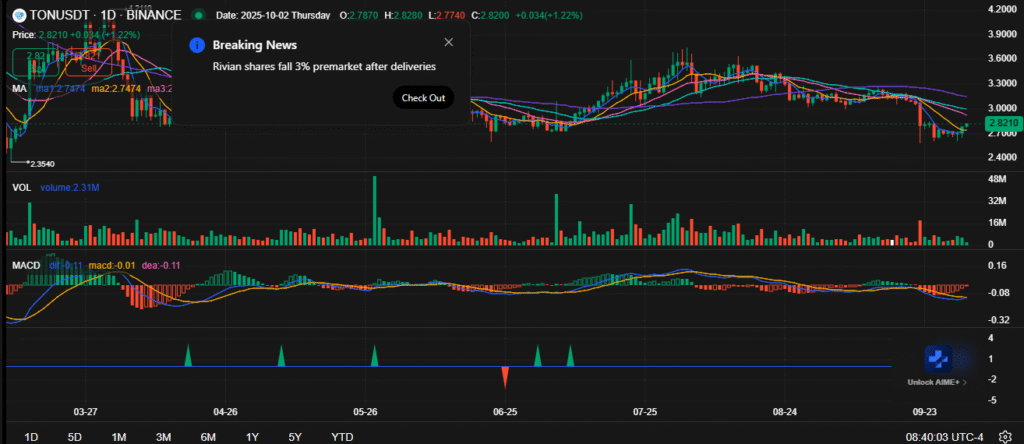
- TON continues to show redistribution signals, with supply outweighing demand and repeated failures at higher levels.
- The token must break above $3.00 and the 20-day moving average to confirm any meaningful recovery.
- MACD shows weakening bearish pressure, hinting at a possible short-term rebound if confirmed by volume.
TON continues to show signs of stress as the market navigates through a redistribution cycle. The price is trading near $2.82, reflecting a modest rebound of 1.22% after recent weakness. Despite this short-term move, the broader structure points toward a challenging path unless momentum strengthens above resistance.
Redistribution Pattern and Market Pressure
The chart highlights a redistribution phase that followed an extended uptrend. In this phase, demand weakens and supply begins to dominate. Price action confirms this shift with repeated lower highs and failure to reclaim earlier levels.
Signs of Weakness (SOW) are already visible as the token tests lower supports. Several failed rallies have shown limited buying strength, while sellers remain in control. The upthrust after distribution (UTAD) further validates this pattern by trapping late entries.
The projected roadmap points to a potential continuation of this trend. Analysts highlight a buy zone significantly below the current levels. If the redistribution plays out fully, TON may extend its decline toward those supports.
Technical Signals and Near-Term Outlook
The daily chart shows TON stabilizing near $2.82 after the decline. Support is identified near $2.35, while $3.00 remains a key barrier. A sustained move above $3.00 would mark an important shift in short-term sentiment.

Source: chart.ainvest.com
Moving averages remain in a bearish alignment, with shorter-term averages positioned under longer ones. This indicates persistent downside pressure, though today’s rise signals an attempt to regain ground. Breaking above the 20-day moving average could provide a clearer trend reversal.
Volume activity remains mixed, falling compared to earlier selloff peaks. The MACD indicator suggests fading bearish pressure with a possible crossover forming. Confirmation of this crossover could support a short-term rally attempt.
Disclaimer: This article is for informational purposes only and does not constitute financial advice. CoinCryptoNewz is not responsible for any losses incurred. Readers should do their own research before making financial decisions.


