
- Futures open interest crosses $500M, signalling growing speculative demand.
- HBAR confirms breakout above March high, targeting $0.30–$0.32 zone.
Hedera’s native token, HBAR, has posted a sharp breakout after months of consolidation. Crypto analyst Crypto Tony highlighted a strong bullish breakout on the HBAR/USD chart, starting near the $0.20 level. His analysis pointed to a breach of a key horizontal resistance zone, with the price moving firmly above it.
The chart suggests a trend reversal, backed by strong upward momentum. This breakout aligns with Crypto Tony’s earlier long-position strategy, confirming the setup for a broader rally.
On the weekly chart, the breakout marks a shift from previous lows, reinforcing the bullish structure. As of now, the price action remains strong, showing no immediate signs of reversal.
Futures Open Interest Surges Above $500 Million
Meanwhile, Coinglass data shows that HBAR’s future open interest has risen sharply, reaching over $500 million. This rise aligns with the price surge from mid-2024 to mid-2025. A simultaneous increase in both open interest and price typically reflects growing market confidence and speculative participation.
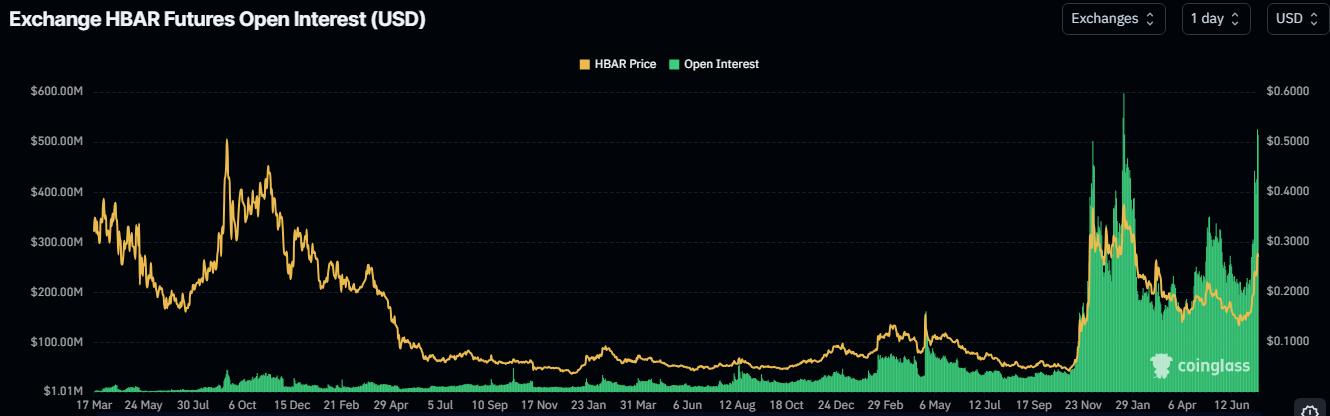
The green spike in open interest, one of the largest recorded for HBAR futures, suggests strong inflows and potential institutional activity.
According to Coinglass, this synchronised movement underscores heightened demand and investor positioning. The correlation between futures volume and price action adds weight to the current bullish case for HBAR.
Price Action Retests Demand Zone
HBAR recently reached approximately $0.27230 following a breakout above resistance from the March swing high. After this sharp move, the price pulled back slightly, possibly retesting the demand zone around $0.23000 to $0.25000. Analysts view this as a healthy retracement within a bullish setup.
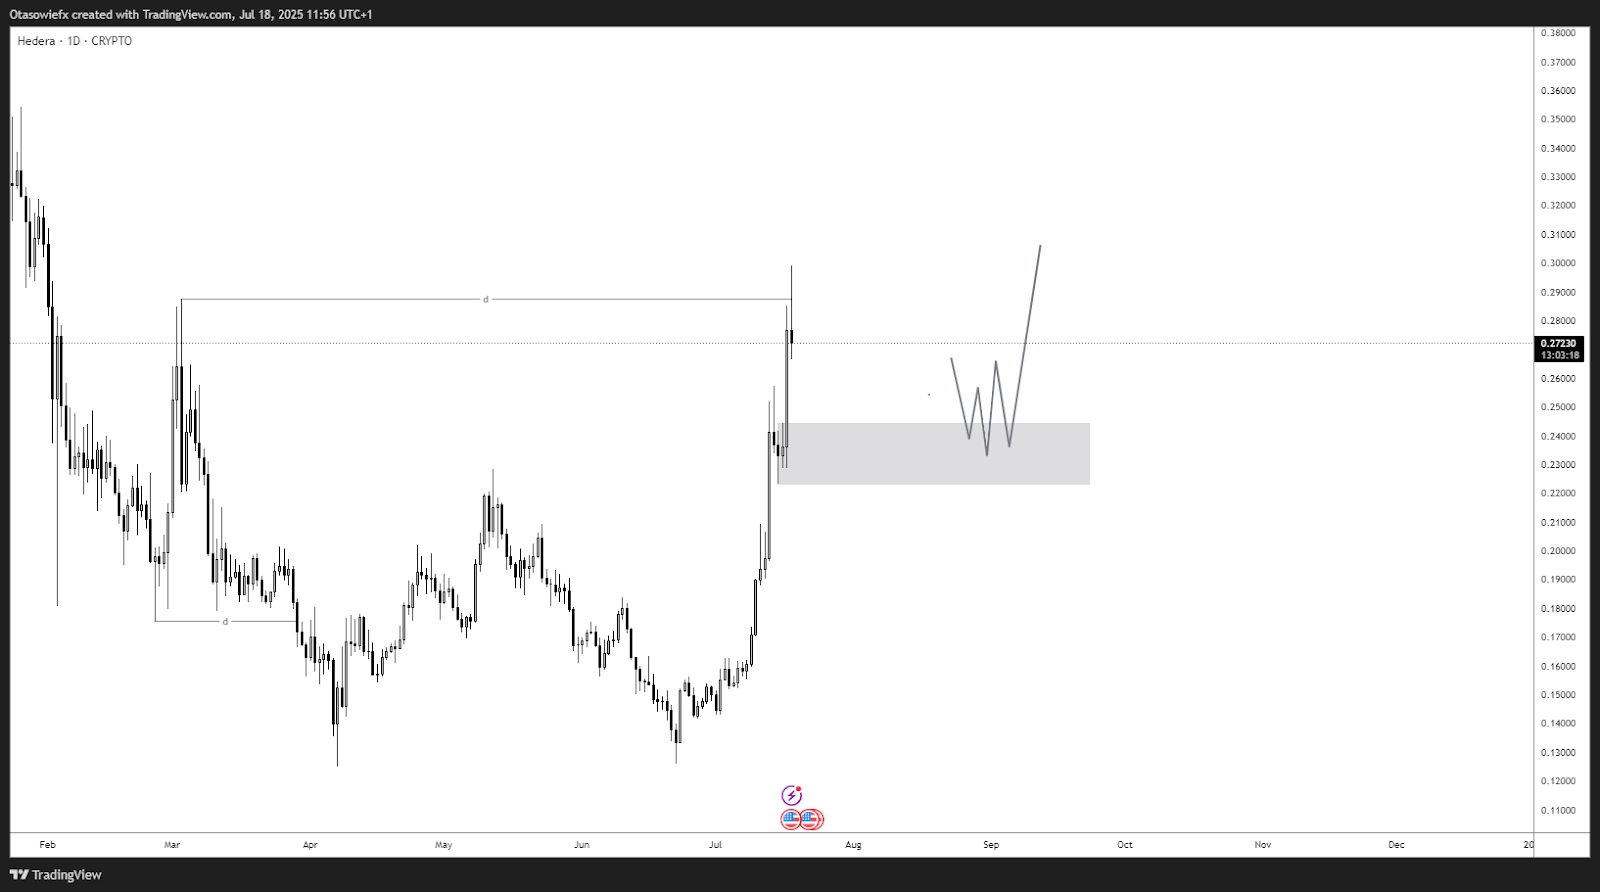
The projected price path on the chart indicates potential continuation toward the $0.30000–$0.32000 range. This forecast assumes the demand zone holds, providing support for another leg higher. The daily chart structure supports this view, showing consolidation before possible continuation.
If current momentum and volume levels persist, HBAR could extend gains in the short to mid-term. Combined technical and market data suggest bullish sentiment remains intact as the token builds support above previous highs.
Disclaimer: This article is for informational purposes only and does not constitute financial advice. CoinCryptoNewz is not responsible for any losses incurred. Readers should do their own research before making financial decisions.