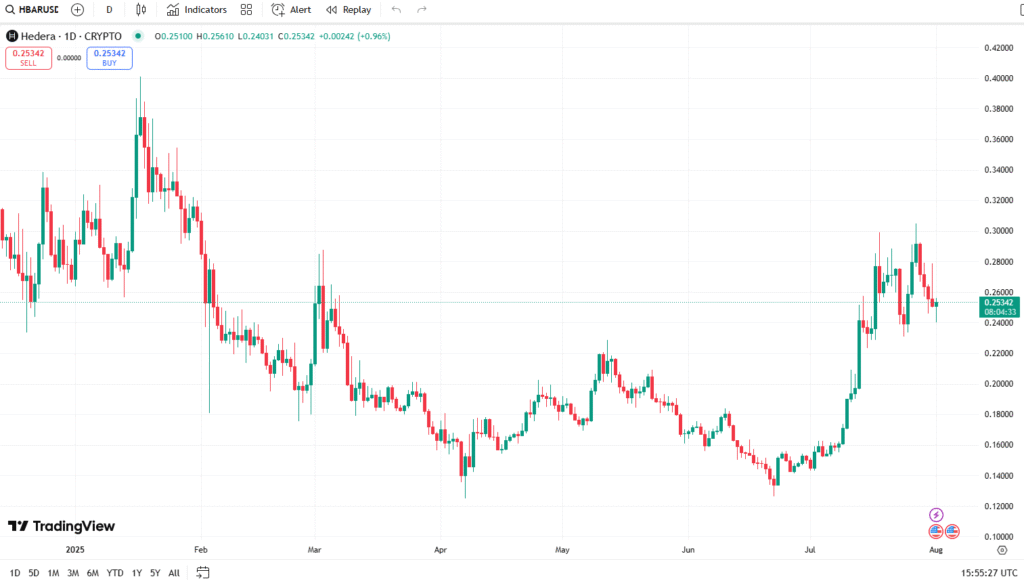
- $HBAR hovers at $0.2615, with support at $0.205 and a triangle pattern under scrutiny.
- Similarity to Ethereum’s chart suggests a potential wave (c) or breakout scenario.
- Global trade uncertainties from the U.S.-EU tariff deal may boost crypto volatility.
Cryptocurrency enthusiasts are buzzing about Hedera ($HBAR) following an insightful analysis by More Crypto Online on X.
The post highlights a striking similarity between $HBAR’s current microstructure and Ethereum’s chart, suggesting a potential wave (c) completion near the $0.205 support level. Alternatively, a triangle pattern is emerging, with a break below $0.231 invalidating this scenario. With $HBAR trading at $0.2615 USD (CoinMarketCap), traders are keenly watching these technical indicators for the next move.
The analysis draws parallels to Ethereum’s recent price behavior, where triangle patterns often signal consolidation or impending breakouts, a trend supported by technical analysis literature (e.g., Chen et al., 2023). These patterns are considered reliable across volatile assets like cryptocurrencies, offering traders potential entry and exit points for risk management. The yellow scenario of a triangle pattern, newly added to the chart, adds an intriguing layer, suggesting a possible pause before a significant price shift.
External factors could amplify $HBAR’s volatility. The U.S.-EU tariff deal, effective today, introduces global trade uncertainties that may drive investors toward cryptocurrencies as hedges, per The Economic Times. This geopolitical context aligns with studies like Liu (2023), which emphasize the impact of uncertainty on crypto markets. A break below $0.231 could signal bearish pressure, while holding above $0.205 might confirm bullish momentum, especially if altcoin seasonality kicks in later this year.

Traders are advised to monitor $HBAR closely, leveraging platforms like TradingView for real-time data. The coin’s recent 8.62% rise in 24 hours (TradingView) underscores its momentum, though caution is warranted given crypto’s unpredictable nature. Whether $HBAR follows a wave (c) drop or breaks out of a triangle, the coming days will be critical.
Disclaimer: This article is for informational purposes only and does not constitute financial advice. CoinCryptoNewz is not responsible for any losses incurred. Readers should do their own research before making financial decisions.


