- HYPE is consolidating within $36–$50 after a +400% rally, with daily buybacks steadily reducing supply and anchoring price stability.
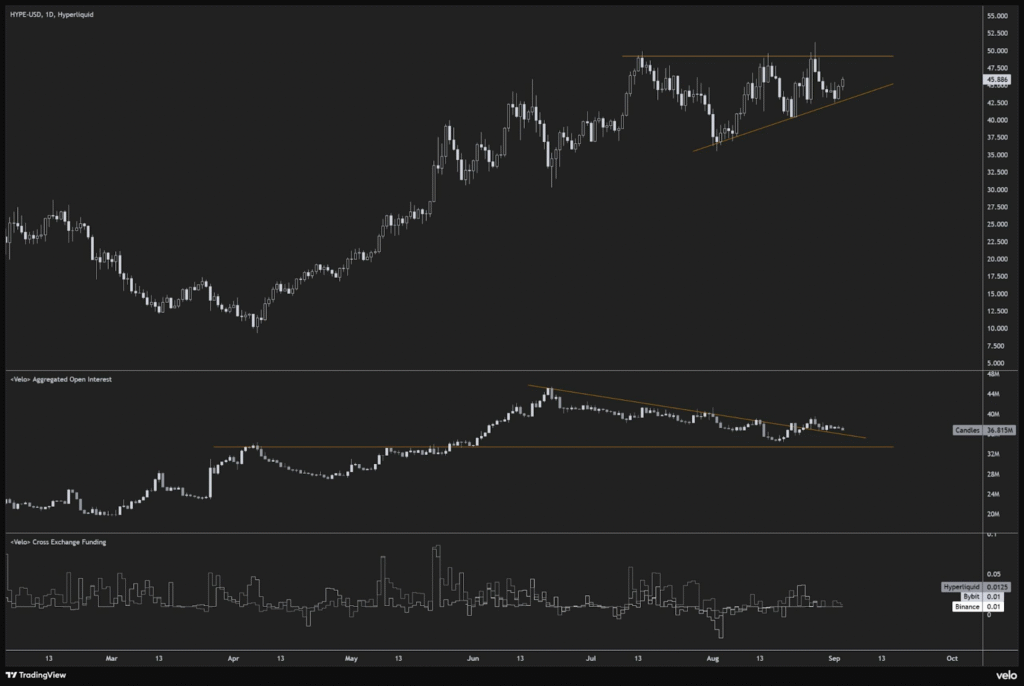
- An ascending triangle pattern is forming near $52, supported by declining open interest and neutral funding, signaling healthier breakout conditions.
- The long/short ratio at 1.9 shows strong bullish bias, but overcrowded longs may trigger volatility if momentum shifts.
Hyperliquid’s HYPE token has consolidated between $36 and $50 for over two months after an earlier explosive rally. The token gained more than 400% in the first half of 2025, and momentum remains significant. Daily buybacks have supported the price by steadily reducing circulating supply and anchoring valuations.
The exchange executed over 30 million HYPE in buybacks, creating a consistent supply reduction that boosted confidence in the market. On 3 September, Hyperliquid purchased nearly 50,000 HYPE worth over $2 million, representing almost all daily revenue. These activities reinforced market stability, even during periods of volatility and pullbacks.

Source:ASXN
Charts show that daily closes align closely with buyback levels, often preventing sharp declines. Larger buyback clusters occurred during consolidation phases, especially in April, June, and July. This pattern shows an active counterforce to selling pressure that maintains price strength.
Technical Structure and Market Conditions
Price action on the Hyperliquid exchange displays an ascending triangle pattern, with resistance near $50–52 and support around $42–43. Buyers continue stepping in at higher levels, while sellers defend the upper boundary, forming a bullish continuation structure. A decisive breakout above $52 could establish new momentum toward higher price levels.

Source:coinglass
Open interest peaked before the $50 zone and has since trended downward, currently around $36.8 million. The decline suggests reduced leverage, which lowers liquidation risks and may enable sustainable market growth. Funding rates across major exchanges remain neutral, showing balanced sentiment and less bias toward long positions.
These factors suggest healthier conditions compared to earlier rallies driven by heavy leverage. Traders are now engaging with reduced risk exposure, which may support a more durable breakout. Market watchers highlight that neutral funding and moderate leverage often precede strong price continuation.
Long/Short Ratio and Sentiment
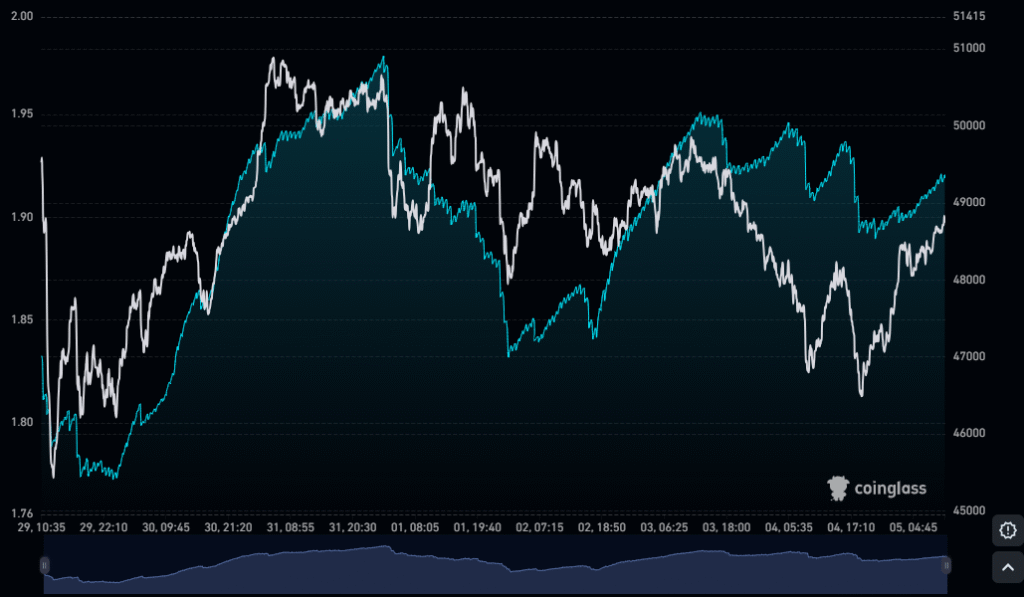
The long/short trader ratio currently stands at 1.8973, showing almost two long traders for every short trader. Long traders number 32,302, while short traders total 17,025, reflecting clear bullish bias. Such imbalance often drives rallies, but it can also create fragility in market positioning.

Source: Tradingview
The ratio often peaks near local tops, and recent moves above 1.95 coincided with price resistance near $50. This alignment suggests that excessive long positioning struggles to sustain upward momentum, leading to frequent corrections afterward. Overcrowding on the long side can therefore trigger volatility.
However, a ratio near 1.9 also demonstrates strong conviction that prices will break higher. If demand persists and buybacks continue, conditions may favor a breakout above $52. Still, any sharp shifts could accelerate downward pressure as long positions unwind quickly.
Disclaimer: This article is for informational purposes only and does not constitute financial advice. CoinCryptoNewz is not responsible for any losses incurred. Readers should do their own research before making financial decisions.


