Polkadot Dips Further as Bearish Momentum Escalates

Polkadot has broken below key support levels with a 6.01% price drop, as bears dominate the market and could face historic lows.

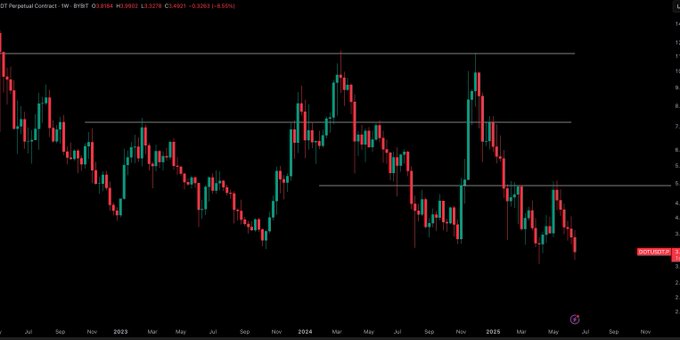
Polkadot has maintained a bearish price action as selling pressure rises in the market. DOT is trading at $3.28 at press time, per CoinMarketCap data. The coin’s trading volume has surged 6% as the price drops, signalling that most traders in the market are selling DOT, and the price could drop further.

Looking at the weekly chart, DOT has been forming lower lows continuously, suggesting a strong downtrend momentum in the past few weeks. The coin has turned the $4.50 support into a key resistance zone after breaking below it. Polkadot has broken several key support zones on its bearish rally and could struggle to break above them if the trend reverses.
DOT
Source: X

So, where are the key levels to watch for?

If Polkadot fails above the $3.00 key support level, the next major resistance zone is at the $2.50-$2.00 range. The are historical lows, lastly seen during the 2022 bearish cycle. If bulls step in above the $3.00 key support, a trend reversal could see DOT attempt to reclaim the $4.5 key resistance zone.

However, with the strong bearish momentum, a strong volume and change in market sentiment will be required for a sustainable rally to attempt a break above this level. The coin’s MACD and smooth moving averages signal a “strong sell”. DOT’s open interest has dipped, showing the market sentiment remains bearish above the 3.00 support. Traders are monitoring DOT’s behaviour around this zone for further insights.

Disclaimer: This article is for informational purposes only and does not constitute financial advice. CoinCryptoNewz is not responsible for any losses incurred. Readers should do their own research before making financial decisions.

Hot this week

XLM Gains Over 7% as Price Tests Breakout Resistance Near 0.25

XLM forms a falling wedge pattern with strong historical...

Pi Consolidates Near $0.25 With Growing Strength Against Market Volatility

Pi holds steady near $0.25 as volume rises, market structure strengthens, and support levels remain firm, signaling stable momentum amid broader market volatility.

BNB Approaches $900 Resistance After Hitting 0.50 Fibonacci Retracement

BNB broke above a descending trendline after holding support...

Kaspa Nears Full Coin Emission as Market Cap Tops $1.6B in 24-Hour Spike

Kaspa surges above $1.6B market cap as strong price action, rising volume, and improving technical signals boost momentum while its near-complete emission strengthens long-term market positioning.

Powerful Bitcoin Reset: 3 Bullish Signals Behind the Massive OI Crash

Bitcoin’s open interest plunges 20% to $30B — the...

Topics

XLM Gains Over 7% as Price Tests Breakout Resistance Near 0.25

XLM forms a falling wedge pattern with strong historical...

Pi Consolidates Near $0.25 With Growing Strength Against Market Volatility

Pi holds steady near $0.25 as volume rises, market structure strengthens, and support levels remain firm, signaling stable momentum amid broader market volatility.

BNB Approaches $900 Resistance After Hitting 0.50 Fibonacci Retracement

BNB broke above a descending trendline after holding support...

Kaspa Nears Full Coin Emission as Market Cap Tops $1.6B in 24-Hour Spike

Kaspa surges above $1.6B market cap as strong price action, rising volume, and improving technical signals boost momentum while its near-complete emission strengthens long-term market positioning.

Powerful Bitcoin Reset: 3 Bullish Signals Behind the Massive OI Crash

Bitcoin’s open interest plunges 20% to $30B — the...

Ethereum Whale’s Epic $7.5B Rise: A Stunning 10-Year Crypto Triumph

Ethereum ICO whale transforms $79K into $7.5B over 10...

Arbitrum’s 2025 Setup: The “Undervalued” L2 Showing a Powerful 50% Reversal Signal

Michaël van de Poppe flags ARB as “extremely undervalued”...
spot_img

Related Articles

Popular Categories

spot_imgspot_img