

- SEI is currently facing resistance at a key trendline, stalling price movement.
- A breakout above this resistance could lead to significant upward price action for SEI.
- SEI’s price surge shows potential, with an increasing trend toward breaking resistance.
SEI ($SEI) has been under pressure as it faces a strong resistance trendline. The trendline, which has held since early November, has been a significant barrier to upward price movement. Despite brief attempts to break through, SEI’s price continues to be constrained by this trendline, preventing a breakout.
Analyst Ali Martinez recently noted, “This resistance trendline keeps holding SEI back. Break it, and we get fireworks.” This comment underscores the significance of the trendline in limiting price action.
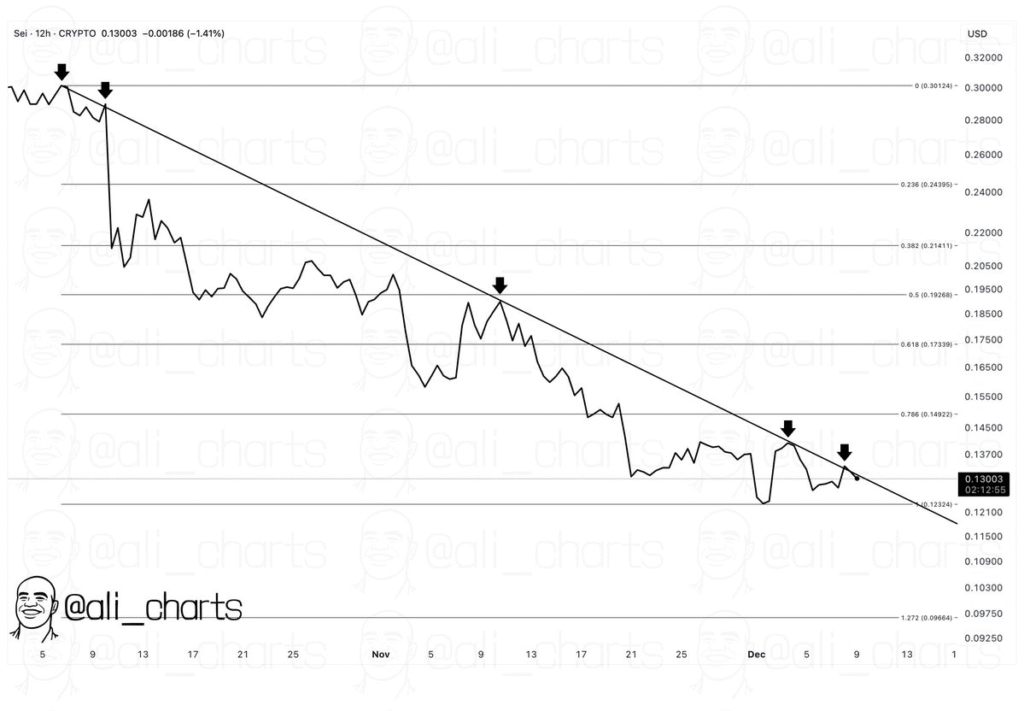
At press time, SEI’s price stands at $0.1375, having recently surged by over 4%. Despite this movement, it remains stuck below the resistance, keeping traders and investors cautious.
Potential Breakout Could Spark Strong Price Action
If SEI manages to break above the resistance trendline, analysts suggest that the price could experience substantial gains. The resistance zone has kept the price contained, but if it is breached, it could open the door for a sharp upward movement.
SEI’s current market cap stands at around $875.97 million, with a trading volume of $57.96 million. These numbers reflect increased interest in the coin, which may also signal that a breakout could lead to more robust market participation.
As the price approaches this key trendline resistance, more traders are watching for a decisive move above this level. Once the trendline is broken, SEI could see significant price action, confirming the potential for a substantial rally.
Disclaimer: This article is for informational purposes only and does not constitute financial advice. CoinCryptoNewz is not responsible for any losses incurred. Readers should do their own research before making financial decisions.