- Critical Breakout Level at $250 – A weekly close above $250 could trigger Solana’s next major bull run toward higher valuations.
- Ascending Triangle Signals Strength – Higher lows and resilient accumulation confirm growing demand, with a long-term technical target set at $1,250.
- Short-Term Battleground at $232–$235 – Consolidation at this support zone will decide whether SOL regains bullish momentum or tests lower levels.
Solana (SOL) maintained consolidation near $235 after retreating from recent highs, while its weekly chart continued to suggest a long-term breakout pattern. The token traded with volatility, but accumulation signals persisted as buyers positioned near critical levels. Market structure pointed to a potential rally if resistance at $250 breaks decisively.
Weekly Ascending Triangle Setup
On the weekly timeframe, SOL formed an Ascending Triangle pattern, signaling accumulation before a possible breakout. The structure combined rising demand with horizontal resistance near $250. Repeated tests of resistance highlighted strong supply, while higher lows reinforced buyer strength.
A confirmed weekly close above $250 would validate the bullish continuation pattern. Such confirmation could mark the beginning of a strong upward phase in 2025–2026. The setup suggested that consolidation is nearing completion, with long-term buyers building positions ahead of a possible expansion.
The projected long-term target reached $1,250, reflecting the measured move potential of the Ascending Triangle. Historical examples of similar breakouts supported this outlook. Failure to secure a weekly breakout would extend the consolidation phase and delay the anticipated upward trajectory.
Intraday Price and Volume Action
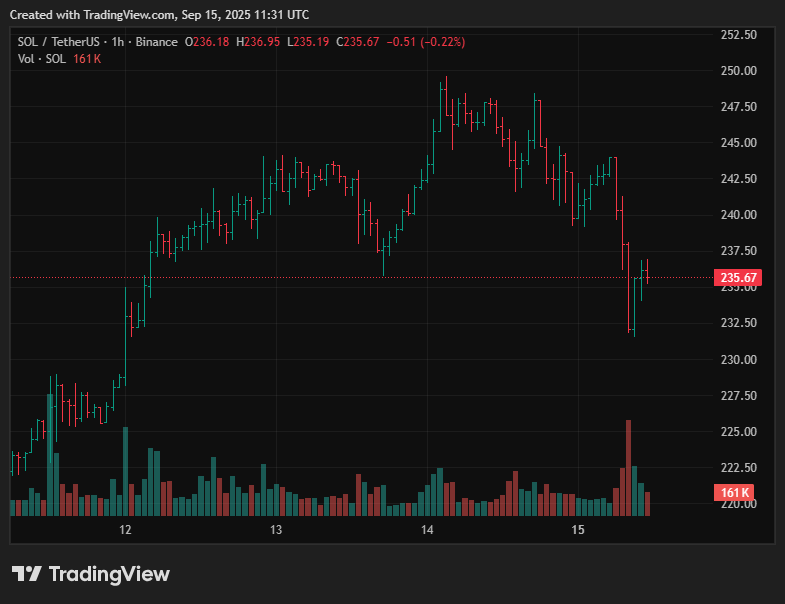
The 1-hour chart showed volatility as SOL retraced from highs near $250 to consolidate around $235.67. Short-term rejection at resistance confirmed the significance of the $250 barrier. Sellers applied pressure, but buyers managed to hold support within the $232–$235 range.

Source: TradingView
Trading volume spiked during the September 15 decline, suggesting active distribution as price weakened. After the drop, volume eased as price stabilized, signaling reduced panic. However, sentiment remained mixed while consolidation continued at lower ranges.
Support appeared firm between $232 and $235, absorbing downward pressure. A rebound would require momentum to retest $240–$242 resistance. Failure to hold could expose price to the $225 region, where another support cluster may provide relief.
Market Outlook
In the near term, SOL balanced between consolidation and correction. The $232–$235 support zone emerged as the immediate battleground. A move above $242 could revive bullish momentum and bring $250 back into focus.
The broader weekly outlook remained intact, with the Ascending Triangle highlighting bullish continuation potential. Higher lows and accumulation supported long-term optimism. Traders may look to the $250 level as the decisive signal for the next phase.
Overall, Solana’s structure pointed toward growth potential. Near-term volatility persisted, but long-term signals projected a path toward $1,250.
Disclaimer: This article is for informational purposes only and does not constitute financial advice. CoinCryptoNewz is not responsible for any losses incurred. Readers should do their own research before making financial decisions.


