
- $XLM is testing critical support at its ascending trendline.
- Analysts suggest a potential breakout above $0.35–$0.40 for $XLM.
- $XLM could target $0.75–$0.90 if the breakout confirms, with $0.15 as invalidation.
Stellar ($XLM) is currently testing an important support level near its ascending trendline. The price is hovering around $0.241, and this support area has been crucial in previous price movements.
If $XLM manages to bounce from this level, analysts predict it could push toward the resistance zone between $0.26 and $0.27, which has historically rejected the price.
CryptoPulse analysts suggest that this is a key level to watch. For a bullish continuation, confirmation of support at the trendline is essential.
Without this confirmation, there could be further consolidation or a potential breakdown of the trendline, leading to a decline in the price.
Bullish Signals Amid Falling Wedge Formation
Altcoin Pioneers are noting bullish signs in the formation of a six-year falling wedge for $XLM. This pattern typically indicates a potential breakout once the price moves above its upper boundary.
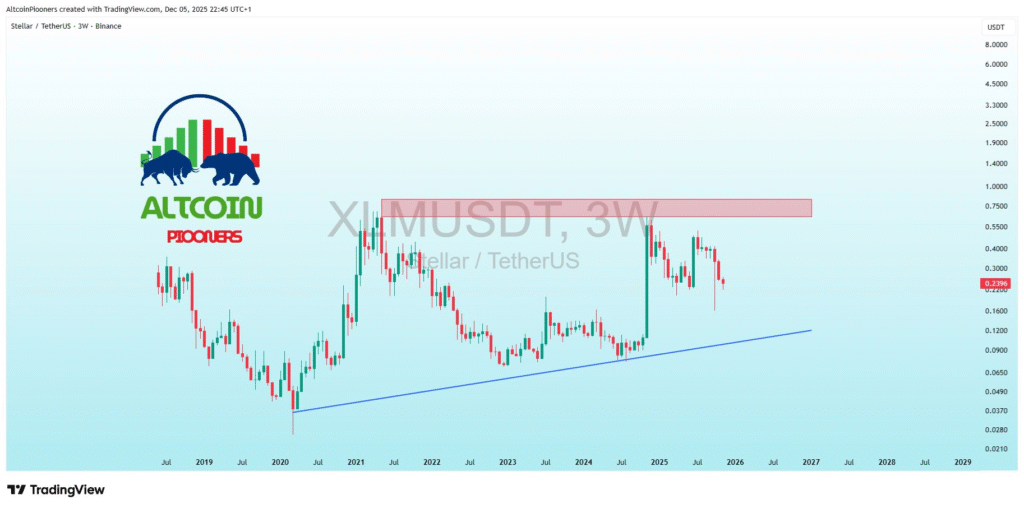
XLM is sitting at $0.229, with the lower boundary of the wedge having been tested multiple times, signaling strong support.
Technical indicators like the RSI are in the oversold zone, suggesting that buying pressure could soon emerge. Additionally, the MACD is showing bullish divergence, indicating a potential shift toward upward momentum.
If $XLM breaks above the $0.35–$0.40 range, short-term targets could be set between $0.75 and $0.90. However, if the price drops below $0.15, the breakout scenario would be invalidated.
Breakout Potential for $XLM
If $XLM manages to hold above the trendline support, it could trigger a breakout toward higher price targets. With the rising trendline and the falling wedge pattern, traders and analysts are closely monitoring these key levels.
A successful breakout could open the door for further gains, potentially taking the price toward the $0.75–$0.90 range. However, confirmation of support and a clear break above the wedge’s upper boundary is necessary to validate these upward expectations.
Disclaimer: This article is for informational purposes only and does not constitute financial advice. CoinCryptoNewz is not responsible for any losses incurred. Readers should do their own research before making financial decisions.