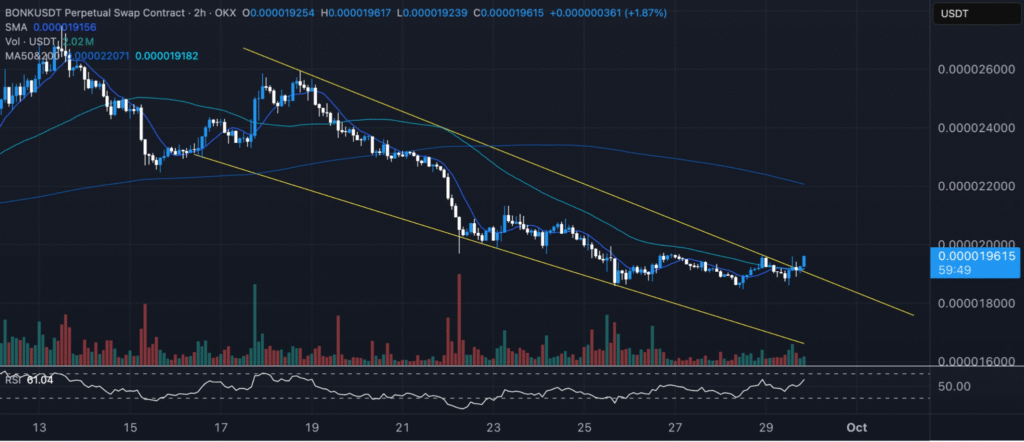
- $BONK TD Sequential buy signal hints at a possible market reversal and price recovery.
- $BONK breaks resistance, signaling potential upward momentum as volume rises.
- RSI at 59 shows room for further upward movement before overbought conditions.
On September 29, 2025, Ali Martinez shared an analysis on Twitter using the TD Sequential indicator for $BONK/USDT. The TD Sequential flashed a buy signal, a potential indication of a bullish reversal after a period of decline.
The chart, based on a 2-hour time frame, shows a consistent downtrend in the price of $BONK before this buy signal appeared, raising expectations of a possible trend reversal.
The TD Sequential is an indicator known for its ability to time market tops and bottoms, making it a reliable tool for traders. A buy signal from this indicator typically indicates that a market bottom is forming, suggesting that upward momentum may follow.
Traders monitoring $BONK may find this signal a potential opportunity to enter or adjust positions in anticipation of a price recovery.
Price Breaks Resistance, and Tests Key Levels
As the price of $BONK has been trending downward, it recently broke through the upper resistance of a descending channel. This breakout is a positive technical signal, suggesting that a potential recovery could be underway.

The current price is testing a key resistance level at 0.00000196. If $BONK can maintain momentum and break above this level, it may open the door to further price increases.
Moreover, the Relative Strength Index (RSI) is at 59, indicating that there is still room for upward movement before the coin reaches overbought territory. This suggests that $BONK has the potential to continue its recovery in the short term without being immediately overextended.
Growing Interest Supports Upward Potential
Volume for $BONK has been increasing recently, which is another factor supporting the possibility of an upward price movement. Higher trading volumes often indicate growing interest in an asset, which can contribute to price momentum in the direction of the prevailing trend.
If the price breaks through the 0.00000196 resistance level, the next target could be around 0.00000200, indicating further bullish potential.
This increasing volume, combined with the breakout and the buy signal from the TD Sequential, suggests that $BONK could be poised for an aggressive upward move as the market transitions into Q4 of 2025.
Disclaimer: This article is for informational purposes only and does not constitute financial advice. CoinCryptoNewz is not responsible for any losses incurred. Readers should do their own research before making financial decisions.


