

- TIA is testing a long-term descending trendline, with confirmation hinging on volume and higher highs.
- The short-term bullish recovery expectation has been supported by the fact that Celestia has recovered its market cap of more than 1.3 billion.
- Maintaining a breakout at levels above 1.70 has the potential to cause wider momentum and the critical zone is 1.62-1.65.
Celestia (TIA) is gaining momentum again with price action gaining and market cap taking off above 1.3 billion. The token is trading at 1.69 having increased by 4.2 percent in the past 24 hours. A range of steady support and stable purchasing interest is indicated by a range of between $1.62 and $1.70.
Trendline Test and Technical Structure
The dominant chart feature remains a long descending trendline connecting successive lower highs. TIA is now testing this resistance and attempting to turn upward. A confirmed reversal requires a breakout above the line and higher highs beyond the recent range.
Momentum indicators are showing early improvement, with a rounded basing structure signaling reduced selling pressure. Stronger confirmation would require increasing volume and an RSI move back above 50. Without these signals, price risks rolling over into another lower high.
Key steps for confirmation include a daily close above the trendline, a retest holding as support, and a break of the prior swing high. Meeting these conditions would establish the first phase of a new uptrend. Until then, the setup remains unproven.
Market Data and Growth Outlook
The latest data shows Celestia’s market cap stabilizing at $1.31 billion alongside a fully diluted valuation of $1.93 billion. The rebound reinforces momentum, particularly if price clears the $1.70 resistance with stronger volume support. Immediate support sits near $1.62–$1.65, giving traders defined levels to track.
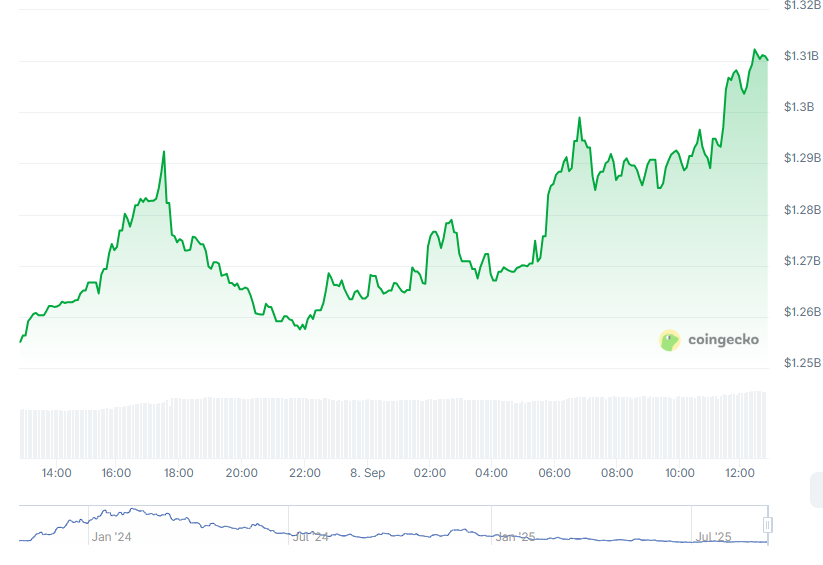
Source: CoinGecko
Upside targets are best staged rather than fixed on single large projections. Prior supply zones and Fibonacci retracement levels represent realistic checkpoints for profit-taking. Ambitious projections such as a 150% rally remain possible but require confirmed continuation patterns.
Overall, TIA’s structure is improving with clearer signs of recovery. The level of 1.70 is the key point to breaking into a bigger bullish run. Follow through beyond resistance would be beneficial to the rally and support the recovery stage.
Disclaimer: This article is for informational purposes only and does not constitute financial advice. CoinCryptoNewz is not responsible for any losses incurred. Readers should do their own research before making financial decisions.