Toncoin Bounces Off a Key Support Zone amid Mixed Signals-What’s Next?

TON has tested and bounced off a critical support and formed a bullish setup. Will the bulls reclaim $4.20?

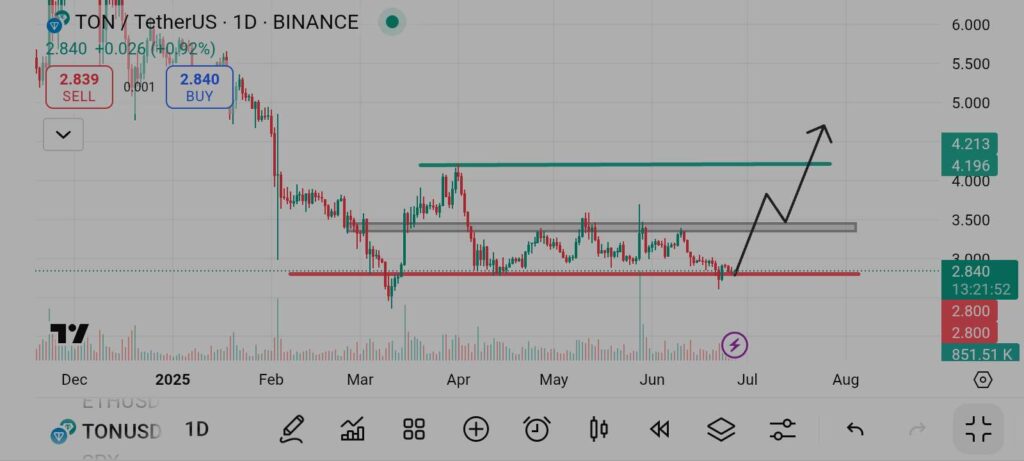
Toncoin is consolidating above a key resistance zone as bullish momentum strengthens. According to CoinMarketCap data, TON is trading at $2.85, a 1.33% price surge over the past 24 hours. Over the past few days, the coin has tested and held above the $ 2.80 support zone several times, signalling a brewing price reversal. Bulls appear to be accumulating following a new confirmed bounce-off and momentum strength above this critical support.

TON’s Bullish Setup on the Chart

A look into TON’s daily chart shows a defined price consolidation and several attempts to begin a price uptrend. The coin’s momentum, MACD level (12,26), and the short-term and mid-term moving averages are flashing “strong buy”. However, since the TON has held the $2.8 support several times, traders appear cautious with their entry, with evident low trading volume.
Source: CoinMarketCap

Toncoin’s derivatives data signal by Coinglass shows a cautious market. The 24-hour long short-ratio stands at 0.994 (lower neutral zone) with low open interest. On the contrary, TON’s open interest (OI)-Funding rate has surged, remaining fairly positive in the same period.

According to a crypto analyst, Alts King on CoinMarketCap, if TON holds above the $2.8 support, the next target could be $3.5, while the bulls aim for $4.20 in the coming weeks. Despite the price consolidation, this key support remains TON’s launchpad for the next bull rally. Failure to hold above this level could trigger a bearish momentum in the coming days. One should watch for changes in volume and open interest above this level for deeper insights.

Disclaimer: This article is for informational purposes only and does not constitute financial advice. CoinCryptoNewz is not responsible for any losses incurred. Readers should do their own research before making financial decisions.

Hot this week

Capital Outflows and Trading Volume Surges Define Crypto’s Transitional Phase

Capital outflows and trading volume surges define crypto’s transitional phase, with inflows dropping 24% and Bitcoin volume spikes signaling key cycle shifts.

Whales Fuel Cardano’s Surge: A Crucial Breakout Zone Ahead

Whales fuel Cardano’s surge as 100M ADA gets accumulated in 24 hours. With 142% yearly growth, Cardano nears a crucial breakout zone around $1.00.

Centralized Exchanges 2025: Spot Trading Volume Dominance

Binance leads with a $2.2 trillion trading volume in...

Bitcoin UTXO Realized Price Distribution Signals Major Market Shift

Significant BTC concentration realized around $100K.Current price aligns with...

Topics

Capital Outflows and Trading Volume Surges Define Crypto’s Transitional Phase

Capital outflows and trading volume surges define crypto’s transitional phase, with inflows dropping 24% and Bitcoin volume spikes signaling key cycle shifts.

Whales Fuel Cardano’s Surge: A Crucial Breakout Zone Ahead

Whales fuel Cardano’s surge as 100M ADA gets accumulated in 24 hours. With 142% yearly growth, Cardano nears a crucial breakout zone around $1.00.

Centralized Exchanges 2025: Spot Trading Volume Dominance

Binance leads with a $2.2 trillion trading volume in...

Bitcoin UTXO Realized Price Distribution Signals Major Market Shift

Significant BTC concentration realized around $100K.Current price aligns with...

Bitcoin Tests Support at $112K Amid Historic ETF Outflow Pressure

Bitcoin consolidates near $112K despite record ETF investor withdrawals.Institutional...

Shiba Inu (SHIB) Poised for a 2025 Comeback? On-Chain Data Hints at a Potential Surge

SHIB’s Realized Cap Impulse signals a potential 125% price...

Binance Coin Eyes $3,000 After Strong Breakout and Market Surge

BNB broke $690 resistance, signaling a potential 320% upward...
spot_img

Related Articles

Popular Categories

spot_imgspot_img