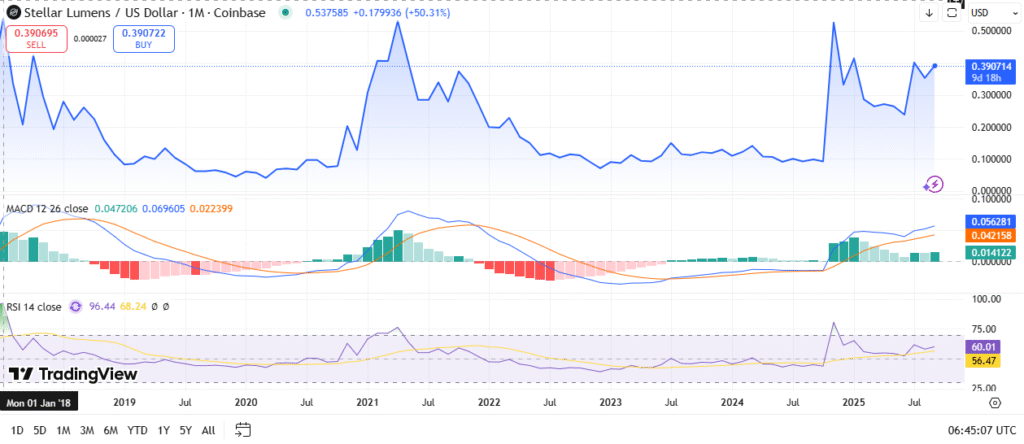
- Stellar Lumens held near $0.39, signaling resilience after past corrections and showing renewed strength toward higher resistance levels.
- The MACD indicator confirmed upward momentum with positive crossovers, reflecting increased buying pressure and potential for medium-term gains.
- With RSI near 60, XLM shows balanced buying conditions, leaving space for further upside before entering overbought territory.
Stellar Lumens (XLM) traded near $0.39 after showing renewed strength in recent sessions. The token held above key support and tested resistance levels. Price movement suggested potential for further upside momentum if conditions remain favorable.
Historical performance highlighted two notable peaks, one in early 2021 and another during mid-2024. Both moves created significant price surges before corrections followed. Market data now indicates consolidation with gradual upward recovery toward higher ranges.
XLM maintained resilience despite extended sideways activity during 2022 and 2023. Market sentiment shifted again in 2024, bringing notable activity and steady recovery signs. Current conditions reflect growing strength across multiple technical indicators.
MACD Confirms Uptrend Continuation
The Moving Average Convergence Divergence (MACD) indicator reinforced bullish momentum in current trading patterns. The MACD line crossed above the signal line, confirming positive movement. Green histogram bars emphasized growing buying pressure across recent months.
Previous cycles demonstrated similar crossovers before major upswings, particularly during the strong rally in 2020. The indicator again points to sustained momentum. Such patterns have historically supported medium-term price growth.
Technical positioning supports potential retests of higher resistance points. A move above $0.42 and $0.46 could pave the way for a $0.50 test. Price continuation depends on volume strength and overall crypto market alignment.
RSI Indicates Sustainable Trend
The Relative Strength Index (RSI) settled near 60, reflecting moderate strength. Levels above 50 and below 70 suggest balanced buying pressure. The indicator provides room for continued upward moves without immediate overbought concerns.

Source: Tradingview
During the 2021 rally, RSI readings approached 96, marking overheated conditions. Current values remain far more sustainable. Market dynamics show a healthier technical backdrop compared with earlier surges.
Future movement will depend on maintaining momentum above support zones near $0.38. A breakout could lift XLM toward $0.50 and beyond. Failure to hold these levels might trigger declines toward the $0.32 area.


