

- The sale off caused the XRP to stabilize around the support area of $2.40, which is an indication of increased strength and high buyer activity.
- Eight out of the last thirteen October months have been bullish; hence the current recovery of XRP is in the established seasonal pattern of upward trend.
- Something in the technical indicators such as the declining bearish MACD indicates that the selling pressure is declining and that there is an imminent short-term rebound.
XRP experienced a fresh wave of volatility this week as its value fell to $1.80, but recovered to its current levels of $2.47 on October 11. The move represented a 2.96 percent gain in a day, which is a recovery to some extent following a tendential market-wide sell-off. Although there has been recent turbulence, the technical pointers now indicate that XRP is potentially stabilizing in a fundamental support area that ranges to approximately 2.40.
Historically, October is a key month to XRP, and eight of the past thirteen October months have closed a bullish. Analysts explain this repetitive trend by the fact that there is increased trading momentum and positive sentiment in the mid-October period. Recent market performance seems to stick to this historical pattern in support of a possible recovery.
XRP is consolidating following a sharp correction implying that the sale activity has come to a temporary halt. The support and resistance zone at the range of 2.40-2.65 has become a point of short-term movement. Price strength that is above this point may enable the asset to develop a better base to achieve additional gains.
Technical Analysis and Indicators.
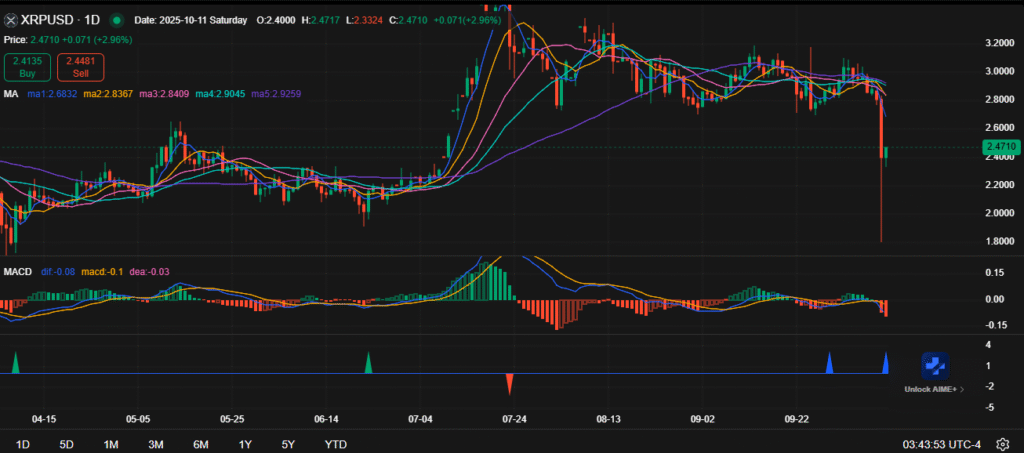
The moving averages (MA12-MA52) indicate that there is a bearish crossover, which proves the existence of pressure on the downside. Nonetheless, the recent recovery of XRP on a rise above the 2.45 level indicates purchasing power at lower prices, which minimizes the short-term negative exposures. A long-term push beyond 2.65 might change the short-term trend towards a possible re-approach of the 2.80 resistance.
Source: chart.ainvest.com
Also, the MACD indicator indicates that the bearish momentum might be dwindling because the bars in the histograms start narrowing. Such a slow decrease in negative momentum favors the eventual shift in neutral ground. The trend shows that market players are putting support levels to the test to wait and see whether there is a potential reversal.
Perspective and Broader Implication.
XRP is still trading in a unstable but formed range with the larger crypto market adapting to recent liquidations. The fact that the intraday lows have been bounced back strongly is an indication of a robust demand and a slow restoration of market confidence. Moreover, maintenance around the existing volumes may give a momentum of a gradual increase in the upcoming sessions.
Although there is a short-term resistance that can curtail the gains, the general mood can be described as moderately positive. Provided that XRP supports at the level of over 2.40, it might mark the beginning of a positive tend. The next week will probably tell whether this recovery process will result in a larger upward trend or a temporary bounce.
Disclaimer: This article is for informational purposes only and does not constitute financial advice. CoinCryptoNewz is not responsible for any losses incurred. Readers should do their own research before making financial decisions.