- $FET faces a potential wave 2 pullback below $0.608, targeting $0.516–$0.49.
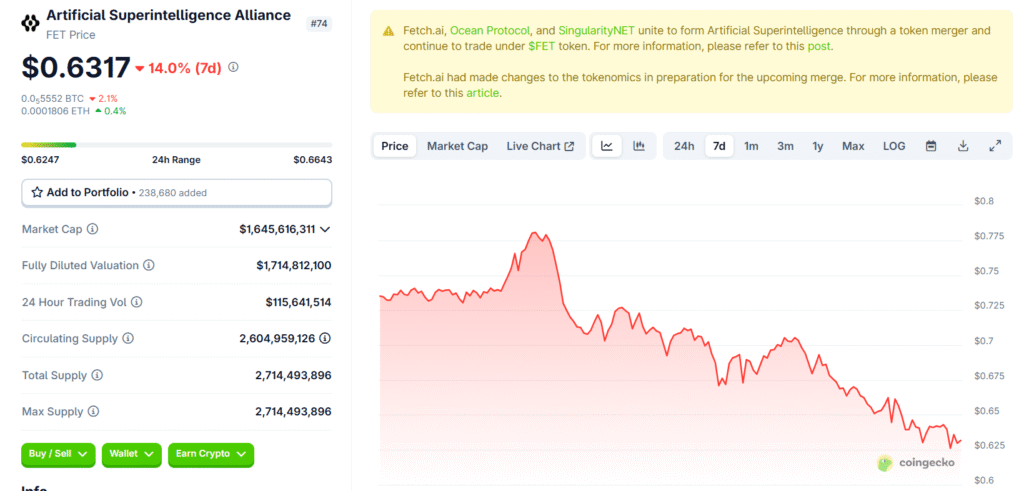
- CoinGecko data shows a 9% weekly drop, lagging Ethereum Ecosystem gains.
- Elliott Wave analysis warns of a bearish turn if support fails.
As of August 2, 2025, the cryptocurrency market is buzzing with speculation around $FET (Artificial Superintelligence Alliance), with a recent X post from @Morecryptoonl offering a detailed technical analysis.
The post,suggests that $FET is hovering in a support zone, potentially setting the stage for a wave 2 pullback under Elliott Wave Theory. The chart indicates a weak setup due to a corrective wave 1, with a critical threshold at $0.608. Should the price drop below this level, the analysis predicts a decline to $0.516–$0.49, aligning with historical price patterns observed in technical studies.
Recent market data from CoinGecko paints a cautious picture, showing $FET down 9% over the past week, underperforming compared to a 12.7% rise in similar Ethereum Ecosystem tokens. This divergence underscores the corrective pressure hinted at in the chart, challenging the bullish sentiment that has surrounded $FET amid its role in the Superintelligence Alliance. Elliott Wave Theory, developed by Ralph Nelson Elliott in the 1930s, emphasizes the fractal nature of market cycles, and this analysis leverages that framework to warn traders of a possible bearish turn if support fails.

The post has sparked varied reactions on X, with users like @agusalvarez010 noting the tricky setup and referencing past analyses from @TravisNolan82 for context. The inclusion of blue boxes—high-frequency inflection areas used by Elliott Wave Forecast—adds precision to the potential reversal zones, a technique gaining traction among crypto analysts. However, the market’s volatility, as highlighted by TradingView’s strong sell signal for $FET, suggests traders should approach this setup with caution, pairing technical insights with real-time data.
As $FET’s price action unfolds, the coming days will be critical. A break below $0.608 could confirm the yellow scenario, while holding above might delay the pullback. For now, the analysis serves as a valuable guide for navigating this uncertain terrain.
Disclaimer: This article is for informational purposes only and does not constitute financial advice. CoinCryptoNewz is not responsible for any losses incurred. Readers should do their own research before making financial decisions.


