

- Elliott Wave patterns suggest SUI/BTC remains stuck in corrective structures, limiting immediate upside potential.
- Moving averages and MACD indicate equilibrium, and there is no strong trend which implies that the market is not strong willed.
- Short-term boundaries of potential breakouts are characterised by support at about 0.00002800 BTC and resistance at about 0.00003500 BTC.
SUI against Bitcoin is showing signs of consolidation as different technical tools project mixed outcomes for the pair. Price action remains trapped between corrective chart patterns and neutral momentum indicators. Traders face indecision as SUI/BTC hovers around critical support and resistance zones.
Corrective Structures and Fibonacci Levels
The Elliott Wave perspective indicates that SUI/BTC continues to work through complex corrective patterns. The labeling highlights multiple a–b–c sequences following an earlier impulse wave. This suggests the pair has not yet entered a strong new upward cycle.
Fibonacci retracement 38.2, 50, 61.8, 78.6% are important levels of possible support and resistance. The present trading levels are still in this retracement zone, indicating indecisiveness and no chances of other corrective swings. These zones define where price may either reverse higher or extend downward.
The corrective setup implies limited upside momentum in the near term. Pullbacks toward retracement levels could shape market direction. Only a decisive break above previous highs would shift the outlook toward a new impulsive rally.
Moving Averages and Volume Signals
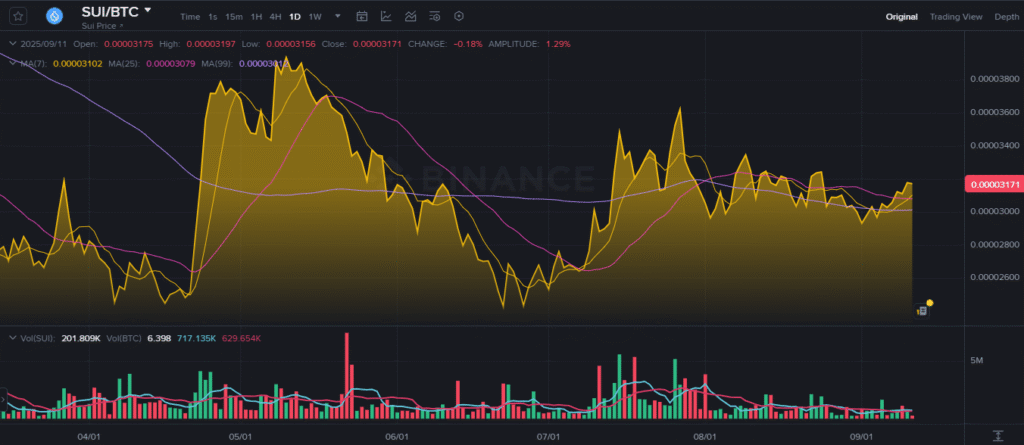
The short-term 7-day moving average is aligned near 0.00003102 BTC, just below the latest market price. The 25-day and 99-day moving averages also sit close to 0.00003100 BTC, showing convergence. This alignment signals equilibrium with no dominant trend.
Source: Binance
Trading volumes reached about 201.8K SUI, equal to 6.39 BTC during the latest session. The histogram of volume bars shows alternating green and red activity. Recent sessions, however, indicate weaker volume compared with earlier surges.
This reduction in activity highlights cooling momentum. Without stronger trading interest, the likelihood of significant breakout moves is limited. The balance between buyers and sellers reflects a consolidating market.
Indicators and Broader Assessment
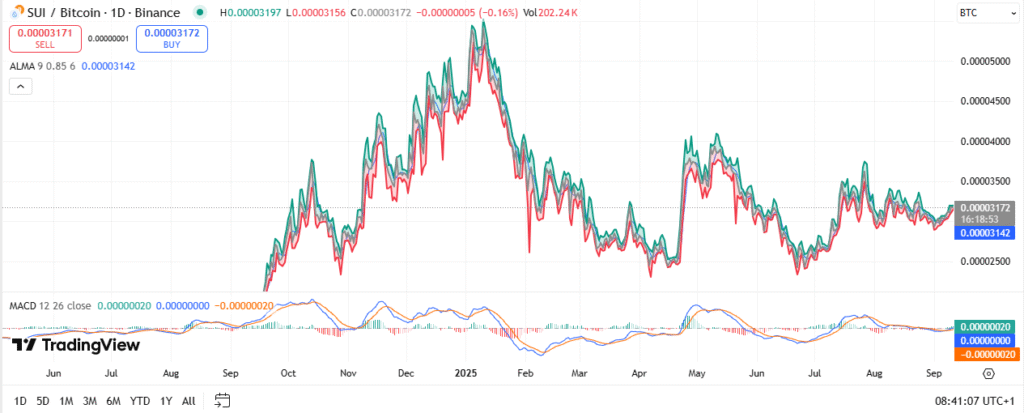
The Arnaud Legoux Moving Average tracks close to the live price at 0.00003142 BTC, reinforcing stability. The MACD line and signal line both remain near zero, reflecting weak momentum. Small divergences emerge occasionally, yet they fail to confirm a trend.
Source:TradingView
Overall, SUI/BTC demonstrates a neutral market environment. Price behavior reflects a year of rallies and retracements that have settled into consolidation. Key levels at 0.00002800 BTC and 0.00003500 BTC now define immediate support and resistance.
The market is positioned between corrective patterns and neutral indicators. Until volume and momentum strengthen, SUI/BTC may continue moving sideways. The outlook remains defined by indecision, but future triggers could push the pair toward new directions.
Disclaimer: This article is for informational purposes only and does not constitute financial advice. CoinCryptoNewz is not responsible for any losses incurred. Readers should do their own research before making financial decisions.