- Trendline Breakout Signals Shift- SHIB has now surpassed a seven-month downward trendline giving it a potential change of weakness to recovery.
- Critical Retest Underway the token is also testing a former resistance now support. The possession of this level may testify to bullish momentum.
- Sight Upside Targets Upside momentum may carry SHIB to resistance levels between 0.00001650 to 0.00002000, and any setback may push the stock to the consolidation phase.
The Shiba Inu (SHIB) is trading around vital levels because the currency demonstrates that its momentum changes. The price is now up by more than 4 percent and is now in the higher part of its price consolidation area. The market indicators draw attention to the possibility of a breakout that will redefine the short-term perspective.
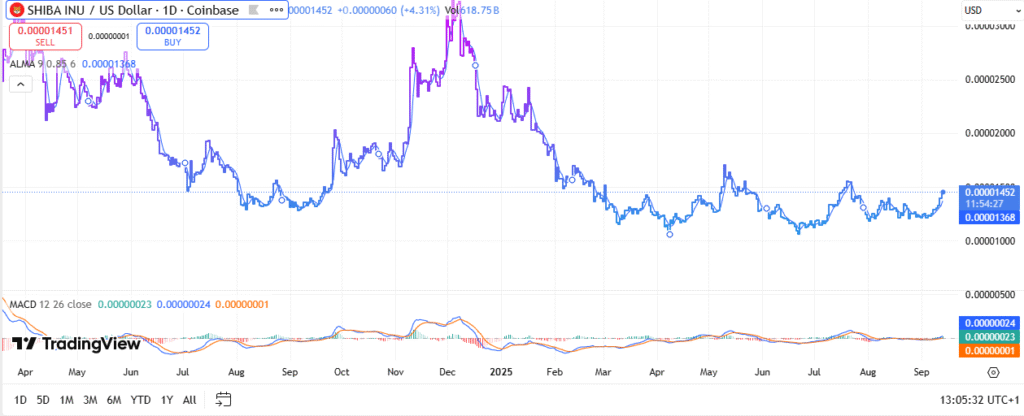
Shiba Inu is currently trading around 0.00001452 after posting renewed gains that signal stronger market activity. Volume reached over 618 billion tokens, reflecting increased participation. This recovery comes as SHIB tests the higher end of a multi-month consolidation channel.
The ALMA moving average at 0.00001368 has provided strong support in recent weeks. Price action holding above this level strengthens the bullish case. If sustained, momentum could extend toward resistance levels between 0.00001650 and 0.00002000.
Technical signals add further weight to the outlook. The MACD line has crossed above the signal line, suggesting an improvement in momentum. A wider gap, combined with volume expansion, would confirm stronger buying pressure.
Breakout and Resistance Retest
The chart structure shows SHIB has broken above a seven-month bearish trendline. This move indicates a possible shift from sustained weakness to recovery. The breakout also cleared a significant horizontal resistance, turning it into support.

Source: Tradingview
Market behavior often retests reclaimed resistance zones to validate breakouts. SHIB currently trades above such a zone, which is now critical support. A successful retest here would establish the foundation for further advances.
If the support holds, SHIB could advance toward higher resistance zones in line with past supply levels. However, failure to maintain momentum risks a return to consolidation. This would delay any larger trend reversal.
Support Levels and Market Outlook
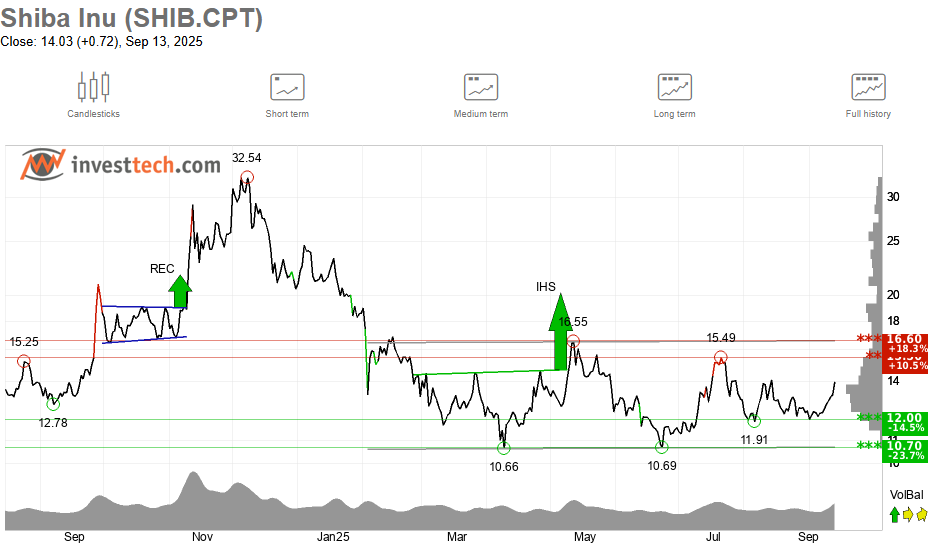
SHIB is still within a broad trading range of 0.00001100- 0.00001500. Price action has been characterised by this range over a number of months. It will be necessary to break out decisively above this ceiling in order to open up to new upside.

Source: investtech
On the negative side, support is at 0.00001200- 0.00001300. The buyers have also resisted such levels and avoided greater losses. But continued experiments of encouragement can weaken the strength of it in the long run.
To sum up, Shiba Inu has been at a decisive point following the breach of a long-term trendline. The retest of support will be used in the coming days to define whether the momentum is going to continue with the token or it will push it into the consolidation phase.
Disclaimer: This article is for informational purposes only and does not constitute financial advice. CoinCryptoNewz is not responsible for any losses incurred. Readers should do their own research before making financial decisions.


