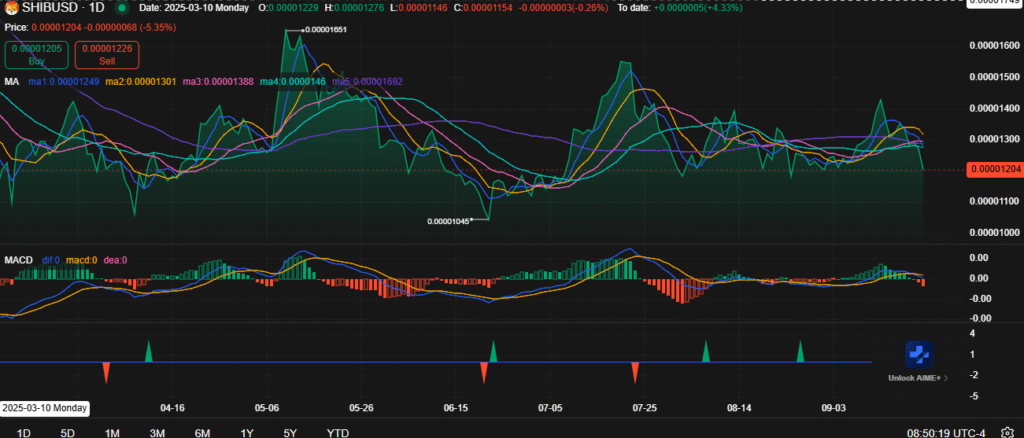
- SHIB broke above its descending trend line, signaling potential for a fresh bullish cycle if momentum holds.
- Resistance remains firm at $0.00001350, while support near $0.00001150–$0.00001045 is crucial to avoid deeper downside.
- A strong rally could drive SHIB toward $0.00001800, aligning with historical rejection points from earlier rallies.
Shiba Inu confirmed a breakout above its descending trend line, signaling a potential shift in momentum after months of consolidation. The move suggested renewed optimism for the token, with traders now watching key levels for follow-through. Price targets point toward the $0.00001800 region, where previous rallies have historically faced resistance.
The breakout represented a major technical development, often seen as the start of new upward cycles in momentum-driven assets. Sustaining this move is crucial, as failed breakouts tend to reverse quickly. A strong continuation above the breakout could trigger further accumulation and buying interest.
Support from the broken trend line now plays a critical role. Holding this level may confirm the bullish structure. A retest followed by strength would validate the breakout and reinforce upward momentum.
Breakout Structure and Market Outlook
The breakout created a clear opportunity for SHIB to extend gains, but resistance levels remain firm overhead. Price must sustain above $0.00001300 for upside continuation. Without this move, bearish pressure could continue to limit growth.\

Source: chart.ainvest
The projected upside aligns with $0.00001800, a level that capped rallies earlier this year. This area now stands as a decisive checkpoint. A successful push toward it could establish the most significant rally in months.
Failure to hold support would undermine the breakout’s strength. Such a reversal would shift focus back to lower accumulation zones. This highlights the importance of short-term levels in shaping broader momentum.
Resistance Zones and Bearish Signals
The moving averages, including MA10 through MA100, are converging tightly. Short-term averages point downward, suggesting limited immediate momentum. Unless price clears $0.00001350, consolidation may dominate.
MACD signals also lean bearish, with histogram bars turning negative. A confirmed cross to the downside would reinforce selling pressure. Such a move could push SHIB toward $0.00001150 or even $0.00001045.
Summary
Shiba Inu stands at a critical juncture after confirming its breakout above a descending trend line. Support zones are being tested while resistance blocks further growth. For recovery, SHIB must reclaim $0.00001350 to reopen the path toward $0.00001800.


