- Ethereum Cyclical patterns point to potential corrections, with $2,400 emerging as a realistic downside target.
- Despite retracements, ETH maintains long-term structure above the 99-day MA, preserving its broader bullish outlook.
- A decisive move above $4,350 could unlock short-term targets toward $4,500–$4,800, while failure risks deeper pullbacks.
Ethereum is showing mixed signals as its price consolidates after recent highs, with potential downside targets emerging from cyclical patterns. The asset trades above long-term support levels, but repeated rejections near resistance zones highlight possible risks. A corrective move could test lower ranges, while long-term momentum remains intact.
Cyclical Structure and Downside Risk
Ethereum has a history of forming peaks followed by sharp retracements, which aligns with its current technical structure. The chart highlights repeated failures to sustain momentum above $3,800–$4,000. If this trend continues, $2,400 becomes a realistic corrective target.
The $2,400 level aligns with a mid-cycle demand zone that previously provided strong support during past corrections. A revisit to this range could serve as a structural reset for price stability. Such corrections have historically prepared ETH for future rallies.
Despite short-term risks, Ethereum still presents opportunities for accumulation within longer cycles. Historical behavior suggests that deep corrections often provide foundations for the next advance. This outlook positions ETH as a long-term play despite near-term volatility.
Technical Indicators and Price Action
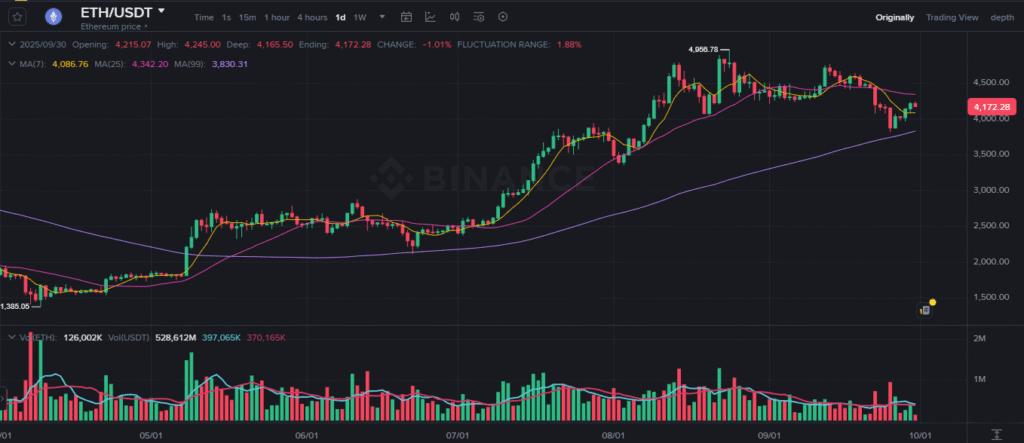
Ethereum trades at $4,172.28, down 1.01% on the day after retracing from the $4,958.78 high. The asset remains above its 99-day moving average at $3,830.31. This long-term support maintains the broader bullish structure.

Source:Binance
Short-term indicators show mixed momentum, with the 7-day moving average near $4,086.76 and the 25-day at $4,342.20. Price is consolidating between these levels, reflecting indecision. A breakout above $4,350 could renew upside momentum, while a drop below $4,080 may extend losses.
Volume reached 528.61M USDT, showing active participation across both rallies and pullbacks. However, trading activity has slowed toward late September, signaling cooling momentum. Consolidation reflects this balance between buyers and sellers.
Outlook and Key Levels
Ethereum continues to stabilize after strong rallies from earlier lows near $1,385. Higher highs and higher lows confirm the broader uptrend. Still, resistance near $4,500–$4,600 has capped progress.
If ETH holds above $4,000 and breaks higher, targets between $4,500 and $4,800 remain achievable in the short term. Conversely, a failure to sustain support could drive a retest of $3,800. Market direction depends on whether buyers reclaim strength above $4,350.
In conclusion, Ethereum faces the risk of a deeper correction toward $2,400 based on cyclical trends. Yet the broader structure remains bullish, with long-term potential intact.
Disclaimer: This article is for informational purposes only and does not constitute financial advice. CoinCryptoNewz is not responsible for any losses incurred. Readers should do their own research before making financial decisions.


