- Holding above the Fibonacci retracement level keeps XLM’s bullish structure intact, with weakness below signaling deeper retracement.
- The confirmed bull flag pattern projects significant upside if momentum builds, even without external catalysts.
- Tight moving averages and flattening MACD suggest a decisive move is approaching, with $0.40 as immediate resistance.
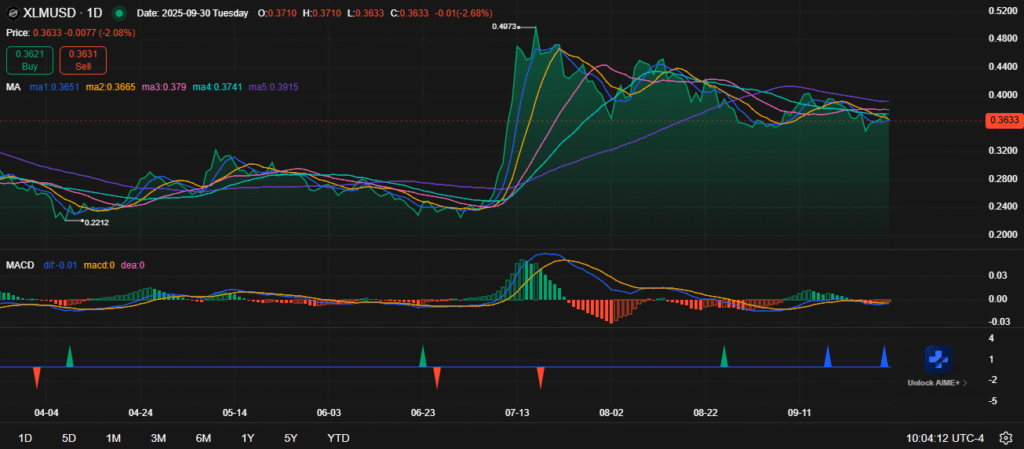
Stellar trades at $0.3633 after a period of consolidation, signaling uncertainty around its next move. The coin shows mild pressure today as technical signals outline both support and potential targets. Analysts highlight a constructive outlook built on a confirmed bull flag pattern.
Support and Resistance Levels
XLM’s key support sits near the .618 Fibonacci retracement line at $0.3365. This level remains critical for maintaining upward structure. A successful defense here could set up a measured move aligning with the previous cycle’s high.
Upside projections target between $1.00 and $1.50 based on the continuation pattern. These levels stand without external catalysts such as ETF approvals. If momentum holds, this range becomes a realistic mid-term objective.
Failure to sustain above $0.3365, however, may shift the market tone toward extended weakness. Sellers could then drive the coin toward deeper retracement zones. The next few sessions may determine near-term stability.
Moving Averages and Trend
The daily chart shows XLM trading close to its moving averages, including MA10 at $0.3651 and MA20 at $0.3665. This clustering indicates indecision between bullish and bearish participants. Breakouts above $0.39 could test $0.40 resistance.

Source: chart.ainvest.com
Price action reflects a steady retracement after peaking near $0.4873 earlier this year. The consolidation phase suggests the market awaits a decisive move. Sustained trading above short-term averages could shift momentum upward.
On the downside, continued weakness below $0.36 may expose support closer to $0.34. Breaches there could confirm bearish continuation. Therefore, trend confirmation is essential at these thresholds.
Momentum Indicators and Broader Context
MACD signals show flattening momentum with the histogram hovering near the zero line. Converging signal lines reinforce the likelihood of a strong upcoming shift. A positive crossover could reignite buying interest.
XLM advanced from $0.22 to $0.48 earlier this year, showing strong demand. Since then, lower highs have defined the structure. This pattern reflects cooling sentiment but sustained baseline support.
The broader outlook extends into Q1 2026, with the bull flag structure suggesting a multi-quarter cycle. External catalysts could amplify moves. For now, price remains in a neutral consolidation zone awaiting confirmation.
Disclaimer: This article is for informational purposes only and does not constitute financial advice. CoinCryptoNewz is not responsible for any losses incurred. Readers should do their own research before making financial decisions.


