- Solana faces critical $156 level; daily close below could trigger further declines.
- Solana’s price has dropped 22% this week as market sentiment worsens.
- SOL remains below its 200-day moving average, showing a bearish outlook.
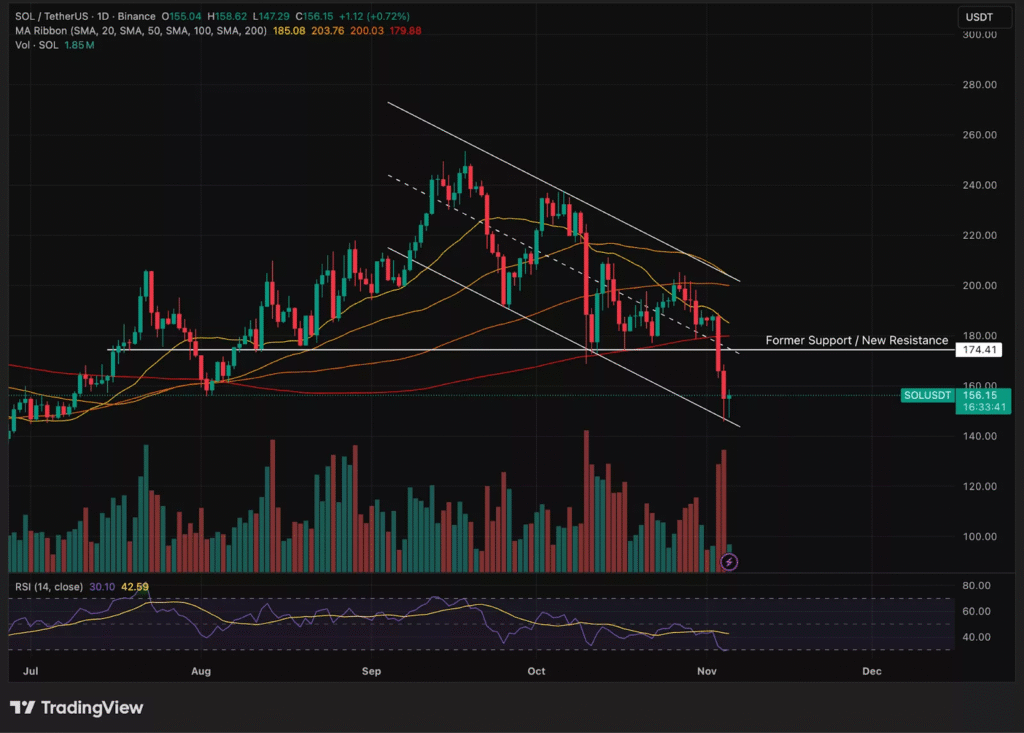
Solana ($SOL) has faced significant selling pressure this week, with its price dropping sharply from $188 to near the $150 support level. The ongoing downturn across the broader cryptocurrency market has impacted Solana heavily, causing it to lose 22% in value over the past week.
CryptoTony recently highlighted a critical level at $156 on the $SOL/USD chart. A daily close below this price could trigger further downside movement.
As of now, Solana is hovering around $157, with its losses from the start of the week suggesting a larger bearish trend. If the selling pressure continues, the $150 support level could be tested again, potentially leading to further declines.
The Wider Crypto Market Struggles
Solana’s decline is not isolated. The overall cryptocurrency market has lost $300 billion in value, with Bitcoin briefly dipping below the $100,000 mark. This decline has affected many major altcoins, with the mood across the market remaining negative.

The crypto sector has been under considerable stress, with many assets experiencing sharp drops in value.
The current market sentiment is creating additional headwinds for Solana. Traders are showing caution, making it harder for assets to recover from recent losses.
Bitcoin’s pullback has dragged the broader market lower, including Solana, and is likely to continue weighing on prices in the short term.
Solana’s Outlook: Could the $150 Support Hold?
As Solana’s price tests the $150 support zone, its future direction hinges on whether this level can withstand further selling pressure. If the broader market sentiment improves, Solana may consolidate near $150 and could eventually make a healthier move higher.

However, if negative sentiment persists, a continued decline could lead to a breakdown of this support level, pushing Solana to even lower prices.
The $175 level remains a critical resistance zone for Solana. If the price struggles to reclaim this level, it may be hard for buyers to regain control. With the overall market in a downturn, any recovery attempt could face significant resistance, leaving Solana vulnerable to further price declines in the near term.
Disclaimer: This article is for informational purposes only and does not constitute financial advice. CoinCryptoNewz is not responsible for any losses incurred. Readers should do their own research before making financial decisions.


