- XRP holds key support, showing potential for upside movement if resistance is broken.
- XRP’s weekly RSI matches levels seen before last November’s rally, signaling upward momentum.
- XRP dominance chart suggests a key decision phase after Wyckoff accumulation pattern.
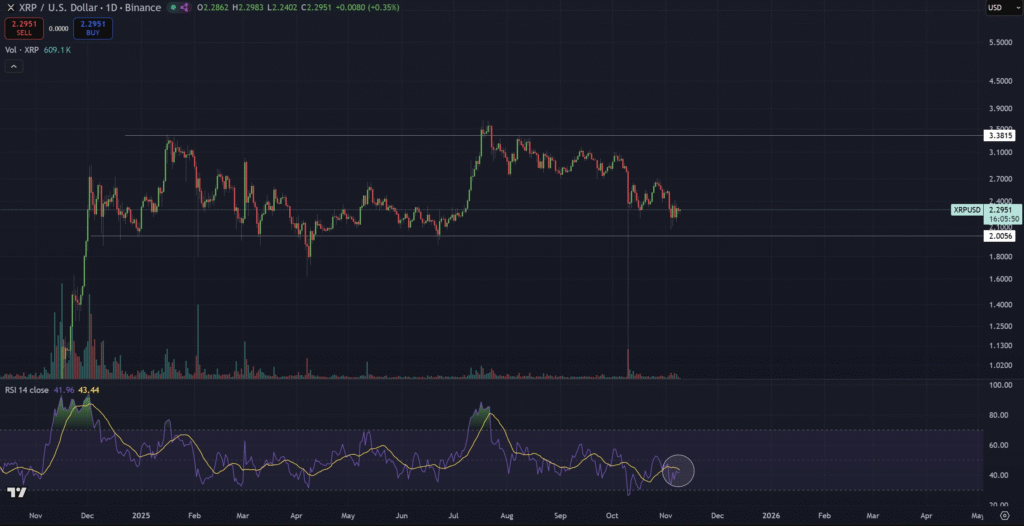
XRP has shown resilience by holding its support levels near the range lows on the daily chart. The price action has remained in a narrow range, suggesting consolidation after a period of volatility earlier this year.

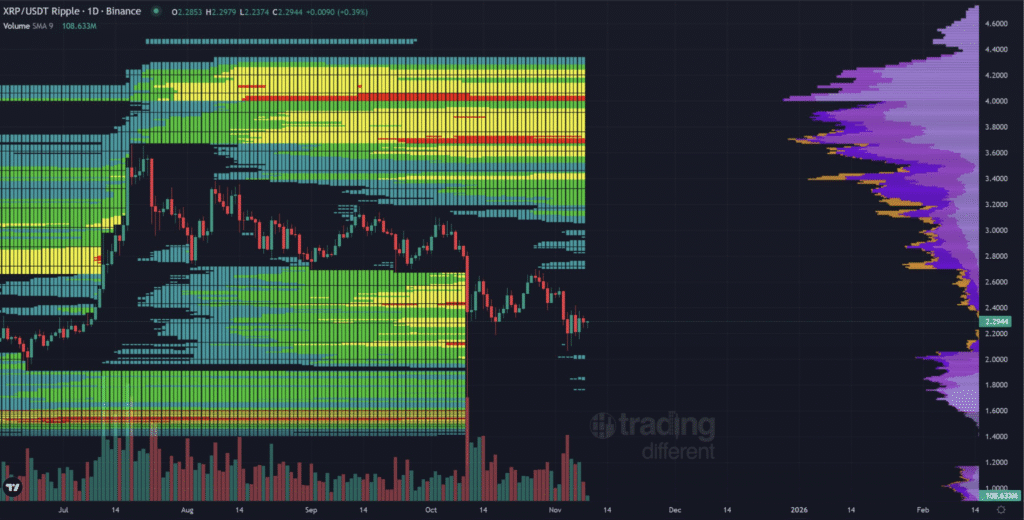
Liquidity conditions above XRP’s current price appear more favorable, as there is limited liquidity below it. The contrast in liquidity suggests that, if the price breaks above its current resistance, there could be a sharp upward move.

Traders are closely monitoring the price for signs of such a breakout, as the chart shows no immediate support below, making a downward move less likely.
Weekly RSI Indicates Potential for Upward Momentum
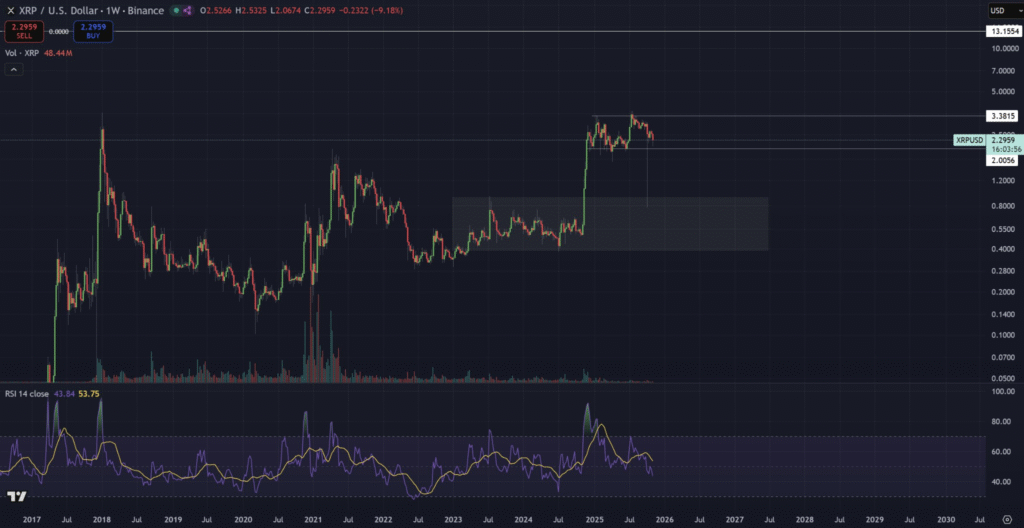
The weekly chart for XRP highlights an important technical feature: the Relative Strength Index (RSI) has returned to levels last seen before the cryptocurrency’s strong rally in November 2023.

This suggests that XRP is in a position similar to that of the previous breakout, where the RSI indicated strong upward momentum.
The RSI is an important indicator used by traders to assess whether an asset is overbought or oversold. Currently, XRP’s RSI is near the level that marked the beginning of a significant rally last year.
If this pattern repeats itself, XRP could be positioned for a similar upward movement in the near future. The market is closely watching the behavior of this indicator for further signs of strength.
XRP Dominance Chart Shows Critical Turning Point
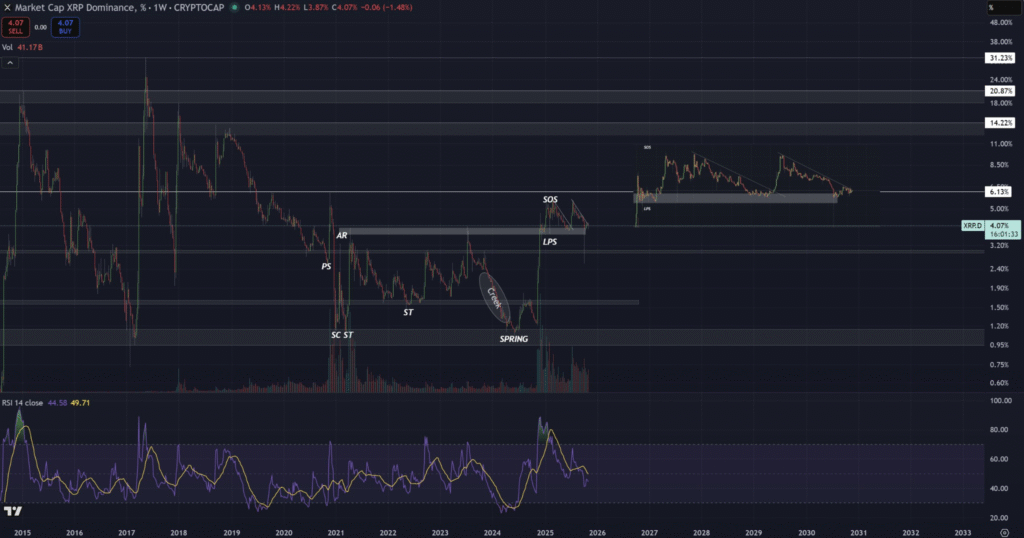
XRP’s dominance chart has formed a Wyckoff accumulation pattern, which typically signals the end of a downtrend and the beginning of a potential upward move. This chart suggests that XRP may be approaching a critical decision point in its market dominance.

The Wyckoff accumulation pattern is a key chart formation that indicates the market is preparing for a shift in direction, usually after a prolonged period of consolidation.
The completion of the Wyckoff pattern suggests that XRP could either break out and gain in market dominance or face a period of stagnation.
Traders are closely watching this chart for any signs of a breakout that could lead to a rise in XRP’s market share. The next few weeks will be crucial in determining whether the accumulation phase leads to upward momentum.
Disclaimer: This article is for informational purposes only and does not constitute financial advice. CoinCryptoNewz is not responsible for any losses incurred. Readers should do their own research before making financial decisions.


