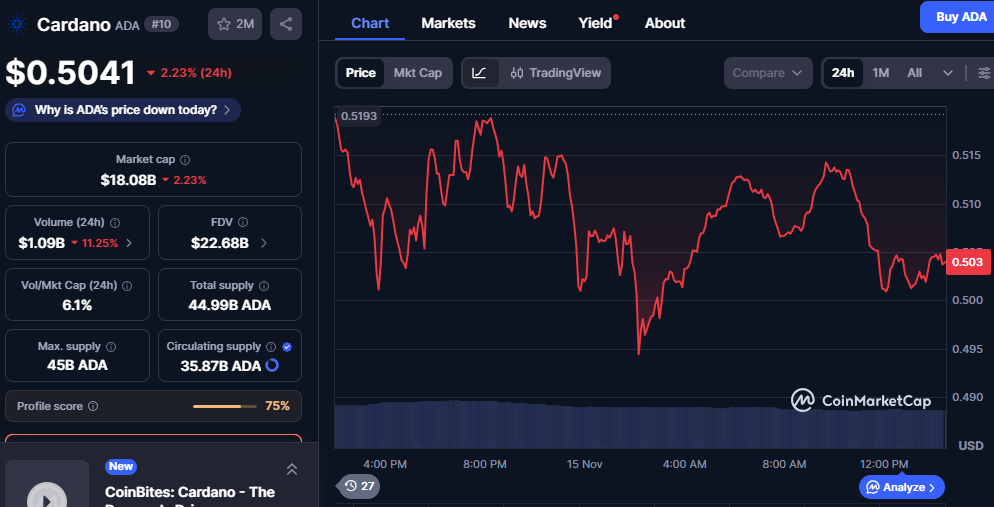
- Cardano ADA has dropped from a 1.29 high into a clear falling channel, with price now anchored near 0.50 dollars.
- The token now trades below former support zones around 0.55–0.81, so any rebound must fight through layered resistance levels.
- Cardano ADA still posts strong daily volume near 1.09 billion dollars, yet lower turnover signals cooling enthusiasm and ongoing supply pressure.
Cardano ADA now trades near 0.50 dollars today after a sharp retreat from last year’s 1.29 peak. Cardano ADA shows a full cycle on recent charts, moving from strong advance into a clearly prolonged corrective phase. The token now faces pressure around former support levels, yet trading data still signals active participation across the market now.
Cardano ADA Technical Structure From Peak to Channel Decline
After the 1.29 high, Cardano ADA slipped into a broad range between about 0.55 and 1.10 dollars. Price then failed to hold midrange levels and Cardano ADA now trades below key areas highlighted as earlier support. This shift in structure confirms a weaker technical picture and it frames current action within a larger downtrend.

Source: Coinmarketcap
Earlier in the period, ADA formed notable highs around 1.13 and 1.07, with price lows near 0.60 and 0.55. Those lows created a clear double bottom pattern, which sparked a strong rally toward resistance below the 1.00 mark. However, sellers returned near that ceiling, and price soon rolled over, turning the successful rebound into a failed breakout.
From that failure, ADA formed a double top around 0.99 and 0.93, then broke the 0.81 support zone. Trendlines drawn from recent peaks now slope downward, and they define a falling channel that contains each rebound attempt. Within this channel, Cardano ADA continues to print lower highs and lower lows, reinforcing the medium term bearish profile.
Cardano ADA Short Term Trading and Market Context
On the short term chart, Cardano ADA trades around 0.50 to 0.51 dollars after a mild daily decline today. During the last session, price opened near 0.519 and then produced a staircase of lower highs and lower lows. As a result, ADA now sits near the lower half of its intraday range and reflects persistent selling pressure.
Reported twenty four hour trading volume approaches 1.09 billion dollars while volume falls about eleven percent from the previous period. The volume to market cap ratio stands near 6.1 percent, which signals active yet slightly softer participation today overall. When price drifts lower while volume cools, the pattern often reflects fatigue among buyers rather than aggressive forced selling.
On the fundamental side, Cardano ADA carries a market cap around 18 billion dollars and a higher fully diluted value. About 35.9 billion tokens already circulate out of a 45 billion maximum supply, which limits future inflation effects. With most supply live, Cardano ADA reacts to changes in demand, sentiment and ecosystem progress across the crypto market.
Disclaimer: This article is for informational purposes only and does not constitute financial advice. CoinCryptoNewz is not responsible for any losses incurred. Readers should do their own research before making financial decisions.


