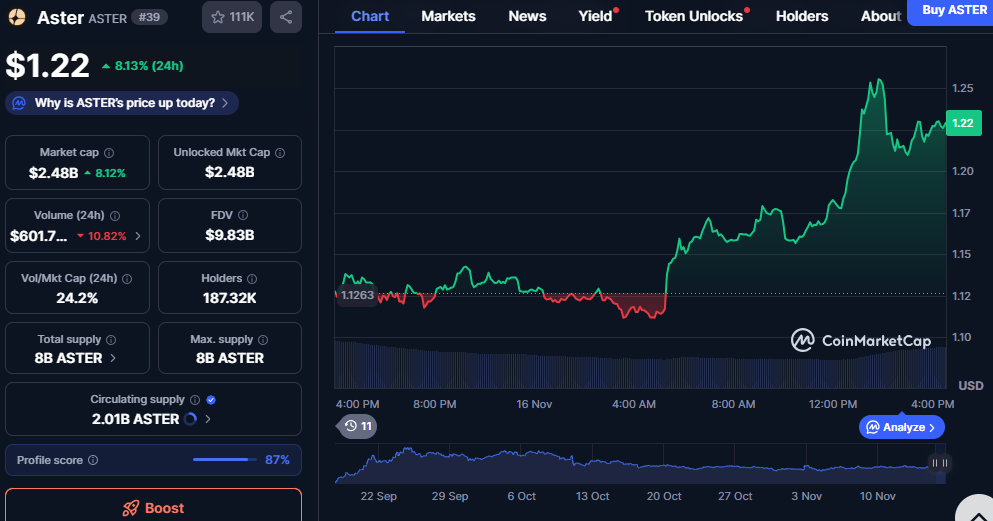
- ASTER strengthens its position with a clean breakout above key price levels, supported by sustained upward momentum and steady participation.
- The asset confirms a technical breakout after forming an inverse head-and-shoulders pattern and rising from a flat correction phase.
- Market data highlights strong turnover and stable holder activity as ASTER maintains an uptrend despite mixed conditions across the wider digital asset space.
ASTER showed a sharp upward move as market activity shifted toward stronger price action. The asset gained traction through a steady rise and held its gains into the session. Moreover, the ongoing surge placed ASTER in focus as interest increased around its pattern setup.
ASTER Price Moves Toward Higher Levels
ASTER traded near the $1.22 mark as strong green candles shaped the latest chart. The asset climbed from a tight range and broke above its recent ceiling with firm momentum. Furthermore, the move developed after a broad consolidation phase held the asset near stable intraday zones.
Trading activity showed persistent strength as ASTER advanced across the chart. The asset pushed past earlier resistance and maintained a clean upward slope without major dips. Additionally, the lack of sharp reversals suggested steady participation during the climb.
Market data showed higher activity even as volume slipped from the previous day. ASTER still recorded strong turnover levels, and the price held steady through the shift. Meanwhile, the asset sustained upward pressure despite the slight drop in volume.
Technical Structure Supports Recent Breakout
Chart readings showed a potential inverse head-and-shoulders pattern forming before the surge. The pattern displayed three clear swing points and created a rising neckline across the structure. Furthermore, the recent move above the neckline aligned with the expected breakout behavior.
Price action advanced as ASTER moved above the $1.20 area and continued upward. The asset carried strong momentum as the candles climbed in a smooth sequence. Moreover, the breakout offered early confirmation for those tracking the technical structure.
The steady rise followed an earlier flat correction period on the chart. That phase held the asset in a narrow channel and prepared the setup for continuation. Additionally, the upward move emerged once the correction ended and the trend aligned with bullish pressure.
Market Context and Background Movement Around ASTER
ASTER continued to operate with a circulating supply near two billion tokens. The broader market valued the asset above the $2.4 billion mark during the session. Moreover, the supply structure signaled that future unlocks could shape long-term performance.

Source: Coinmarketcap
Holder activity remained stable with a sizable base supporting regular market turnover. ASTER maintained community traction as the asset recorded steady participation across platforms. Additionally, the profile score highlighted structured market tracking across reported data.
The broader digital asset space showed mixed performance, but ASTER moved with stronger drive. The asset maintained a clean uptrend despite fluctuations across the wider market. Furthermore, its recent breakout placed attention on its pattern-driven momentum and short-term progress.
Disclaimer: This article is for informational purposes only and does not constitute financial advice. CoinCryptoNewz is not responsible for any losses incurred. Readers should do their own research before making financial decisions.


