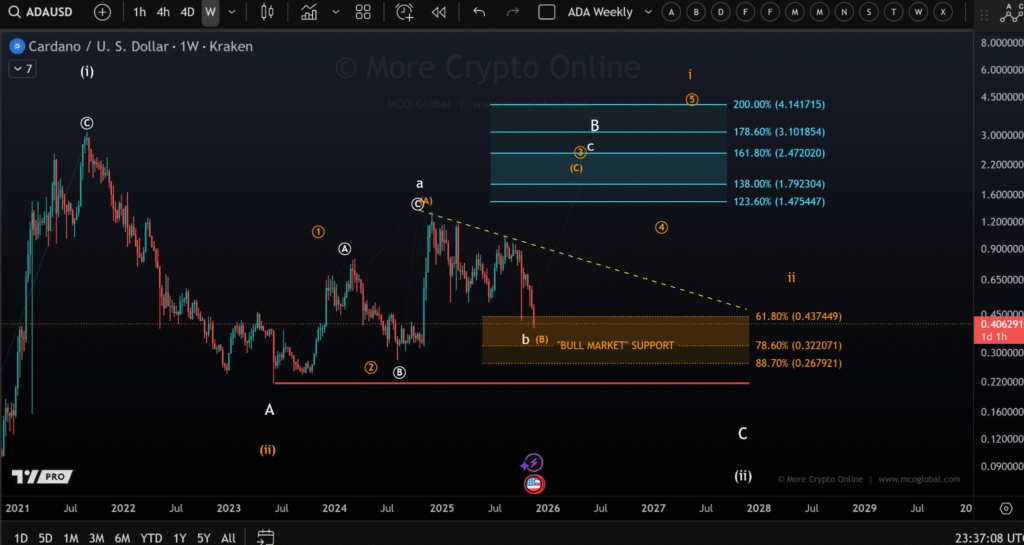
- ADA is inside a critical support zone between $0.322 and $0.437 with no clear low yet.
- A decisive break below $0.267 could signal further downside for Cardano.
- Price structure shows a falling knife, lacking a confirmed 5-wave move up.
Cardano (ADA) is currently trading within a key long-term support zone. Despite the decline, the technical structure still allows for a potential uptrend if crucial levels hold.
Cardano Holds in Support Range Amid Unconfirmed Bottom
Cardano is trading between $0.322 and $0.437, a zone viewed as “bull market” support. Despite the decline, the price has not yet broken below this range decisively. This zone also includes the 61.8% and 78.6% Fibonacci retracement levels.
According to the chart by More Crypto Online, these levels remain crucial as long as the broader market structure supports a bullish outlook.

The analysis categorizes the ongoing movement as a B-wave pullback. B-waves in Elliott Wave theory often retrace deeper than usual and can break support temporarily. Although ADA remains inside this structure, the price has not confirmed a bottom.
Analysts point out that if ADA breaks below $0.322 decisively, it could next test $0.267, which is the 88.7% retracement. Further downside could bring the June 2023 low at $0.215 into focus.
The price structure still lacks the necessary bullish signals. “Until we see a clear 5-wave move up, the long-term low cannot be confirmed,” the analyst stated.
Broader Trend Depends on Reversal Confirmation
Despite the recent fall, ADA may still be within a larger bullish trend if the current support range holds. However, technical confirmation is essential. A complete 5-wave upward pattern must appear to confirm that a sustainable low has been formed.
Currently, ADA’s chart remains declining, often referred to as a “falling knife.” The structure does not show clear upward momentum, which keeps the market in a cautious state. Until bullish movement develops, traders will continue monitoring the 78.6% and 88.7% Fibonacci levels closely.
If the broader market sentiment improves and the chart confirms upward movement, the next resistance levels could range between $1.39 and $1.47 based on Fibonacci extensions. These levels correspond with the potential C-wave targets illustrated in the analysis.
Disclaimer: This article is for informational purposes only and does not constitute financial advice. CoinCryptoNewz is not responsible for any losses incurred. Readers should do their own research before making financial decisions.


