XLM Gains Over 7% as Price Tests Breakout Resistance Near 0.25

  • XLM forms a falling wedge pattern with strong historical breakout trends.
  • Price holds firm at $0.2370 support, attracting short-term buyer activity.
  • Analysts predict target of $0.63 if wedge breakout repeats again.

Stellar (XLM) has been recovering slowly after a sharp decline of 23% over the past month. The price has seen a 0.81% rise in the last 24 hours and is now at $0.2540. Earlier in the day, it touched a low of $0.2518 but has shown consistent buying interest.

The movement remains steady with minor fluctuations, and this small uptrend reflects growing interest among short-term traders. Traders are closely watching the next price levels to see if it holds above support.

Technical Setup Hints at Possible Breakout

XLM is now trading around $0.2370, consolidating at a key support zone. Technical analysis shows that the price is within a falling wedge pattern. Historically, XLM has broken out from this setup, resulting in large upward movements.
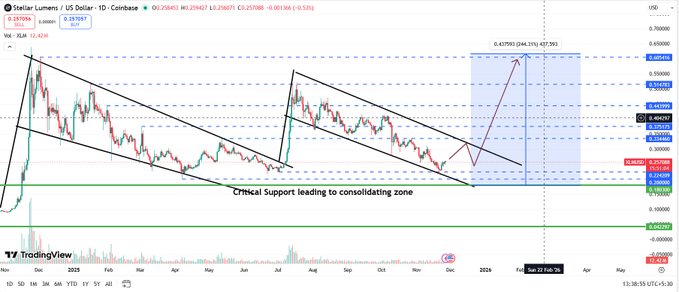
image 409
XLM/USD 1D Price Chart Source: TradingView

The wedge pattern has formed twice earlier, and each time led to sharp gains. The price is currently near the lower edge of this formation, which could act as a base for a new rally.

Analysts suggest that if the pattern repeats, XLM might aim for the $0.63 level. That would be around 147% above its current level. This setup gives technical traders a reason to watch the asset in the coming weeks.

Chart Patterns Indicate Potential Breakout

Technical analysis shows that XLM is nearing the edge of a falling wedge pattern. This formation has appeared before and led to a breakout earlier this year. Historical data shows that such patterns can often lead to a price surge once resistance is broken.

Crypto analyst TheEliteCrypto shared, “XLM is testing the same breakout point seen earlier this year, which led to a sharp rally.” The previous breakout pushed the price over 100% higher. If the current structure follows a similar path, the next target could be in the $0.47 range.

In addition, chart support remains firm near the $0.2370 level, where buyers previously stepped in. Holding above this support is seen as crucial for any further move upward.

Disclaimer: This article is for informational purposes only and does not constitute financial advice. CoinCryptoNewz is not responsible for any losses incurred. Readers should do their own research before making financial decisions.

Hot this week

ADA Price Analysis: Cardano Eyes $0.50 Rebound After Gaining 7% This Week

ADA is trading around $0.43 after rising nearly 7%...

VET Shows Early Bottom Signals as High-Wave Candle Sparks Market Debate

VET shows early bottoming signs as a high-wave candle, rising volume, and firm support levels highlight growing strength across the market and signal a potential trend shift.

Pi Consolidates Near $0.25 With Growing Strength Against Market Volatility

Pi holds steady near $0.25 as volume rises, market structure strengthens, and support levels remain firm, signaling stable momentum amid broader market volatility.

BNB Approaches $900 Resistance After Hitting 0.50 Fibonacci Retracement

BNB broke above a descending trendline after holding support...

Kaspa Nears Full Coin Emission as Market Cap Tops $1.6B in 24-Hour Spike

Kaspa surges above $1.6B market cap as strong price action, rising volume, and improving technical signals boost momentum while its near-complete emission strengthens long-term market positioning.

Topics

VET Shows Early Bottom Signals as High-Wave Candle Sparks Market Debate

VET shows early bottoming signs as a high-wave candle, rising volume, and firm support levels highlight growing strength across the market and signal a potential trend shift.

Pi Consolidates Near $0.25 With Growing Strength Against Market Volatility

Pi holds steady near $0.25 as volume rises, market structure strengthens, and support levels remain firm, signaling stable momentum amid broader market volatility.

BNB Approaches $900 Resistance After Hitting 0.50 Fibonacci Retracement

BNB broke above a descending trendline after holding support...

Kaspa Nears Full Coin Emission as Market Cap Tops $1.6B in 24-Hour Spike

Kaspa surges above $1.6B market cap as strong price action, rising volume, and improving technical signals boost momentum while its near-complete emission strengthens long-term market positioning.

Powerful Bitcoin Reset: 3 Bullish Signals Behind the Massive OI Crash

Bitcoin’s open interest plunges 20% to $30B — the...

Ethereum Whale’s Epic $7.5B Rise: A Stunning 10-Year Crypto Triumph

Ethereum ICO whale transforms $79K into $7.5B over 10...
spot_img

Related Articles

Popular Categories

spot_imgspot_img