- The VET large high-wave candle highlights intense indecision, suggesting the current downtrend may be weakening as both sides fight for control.
- Increasing 24-hour volume and repeated defenses of lower levels indicate growing buyer activity and reinforce the development of a potential short-term base.
- The controlled sideways movement, combined with market correlation to Bitcoin, suggests VET may prepare for a measured push toward upper resistance.
VET shows early signs of bottoming as the market reacts to a large high-wave candle that highlights sharp indecision. VET moves within a narrow range while bulls and bears compete for control after a long period of downward pressure. Moreover, VET continues to attract attention as the chart hints at a possible shift in short-term direction.
Market Context and Technical Behavior
The chart highlights a significant candle with long wicks that signals strong disagreement between buyers and sellers. It reflects aggressive pushes in both directions and leaves the session without a clear winner. Moreover, this pattern often appears when an asset reaches a point where momentum begins to soften.
Price movement follows a descending channel and continues to respect its long-term trend boundaries. Lower highs and lower lows confirm the ongoing downtrend across the wider timeframe. Additionally, the most recent candle dips below the lower band before bouncing, indicating growing buyer activity.
The tug-of-war creates a structure where both sides reassess value around the current zone. This setup frequently appears when the market prepares for a potential base. Furthermore, repeated rejection of extreme lows often contributes to early stabilisation.
Market Activity, Volume Trends, and Support Dynamics
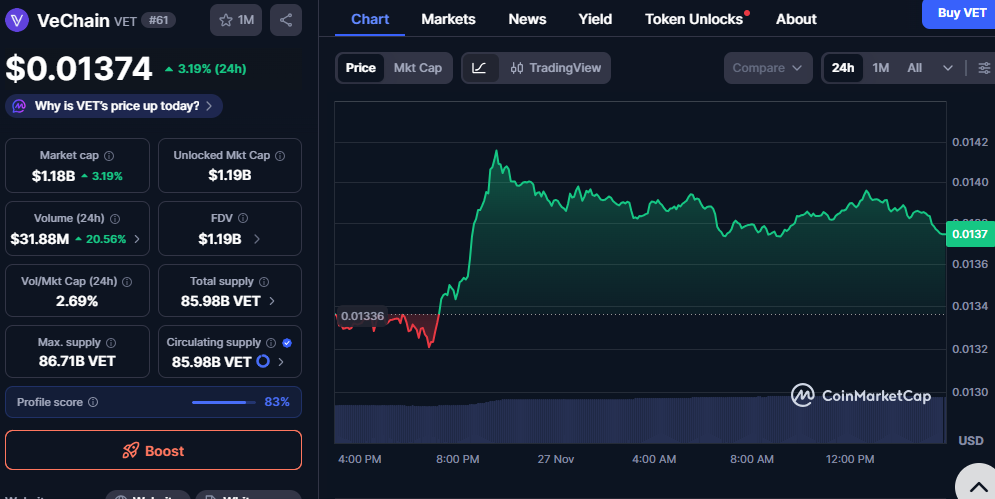
The market records stronger activity as the 24-hour volume rises above previous sessions. Trading behavior reflects growing engagement, and the increase aligns with the modest upward move. Moreover, volume remains steady enough to support a developing recovery attempt.

Source: Coinmarketcap
Price action climbs from earlier lows and forms a rounded shape that signals renewed strength after a period of weakness. This behavior shows that buyers are willing to defend lower areas and maintain upward pressure. Additionally, the chart transitions into a consolidation phase after a sharp push higher.
Support near recent lows remains firm and helps stabilize the developing structure. The area held during the broader downturn and offers a clear reference point for future sessions. Moreover, maintaining this zone increases the chance of a sustained short-term base.
Trend Signals, Market Correlation, and Near-Term Outlook
The chart shows a steady pattern where movement remains controlled within predictable boundaries. Upward attempts face resistance, yet the asset avoids deeper declines during the consolidation phase. Moreover, each bounce adds structure and strengthens the emerging support area.
Correlation with Bitcoin continues to influence direction as larger movements shape market behavior across several assets. Any broad recovery could provide additional momentum toward upper resistance levels. Additionally, steady conditions provide an environment that supports gradual improvement.
The asset holds its ranking within the mid-cap category and maintains competitive performance among peers. Market structure, volume strength, and developing stability indicate potential for measured progress if conditions improve. Moreover, a break above the recent ceiling could mark the start of a more defined upward attempt.
Disclaimer: This article is for informational purposes only and does not constitute financial advice. CoinCryptoNewz is not responsible for any losses incurred. Readers should do their own research before making financial decisions.


