- A double bottom and RSI divergence on altcoin charts suggest weakening bearish momentum.
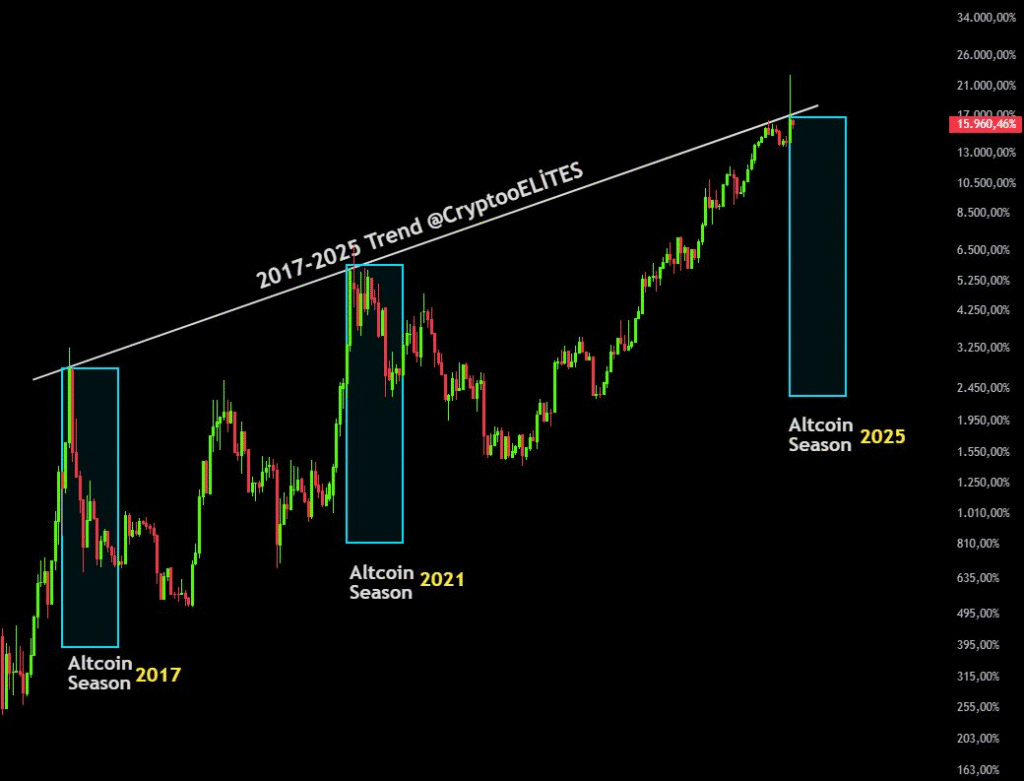
- A historical trendline dating back to 2017 aligns with past altcoin rallies.
- Multiple Golden Crosses since 2023 preceded upward moves, with another forming in October 2025.
Altcoins are showing multiple signs of a potential market rebound, according to several TradingView chart analyses shared in October 2025. A combination of technical patterns and historical trends suggest a possible bullish move by the end of the year.
Altcoin Patterns Point to Possible Market Reversal
MikybullCrypto data highlights a double bottom around the 6.78% level in altcoin dominance. This chart pattern is commonly associated with trend reversals. Alongside this, a Relative Strength Index (RSI) divergence has formed.
Although the RSI remains in a downtrend, it is beginning to flatten, suggesting that bearish momentum may be easing. These signals combined suggest a potential breakout if the market confirms the reversal.
Meanwhile, CryptooELITES also shared a long-term chart covering 2017 to 2025. It showed that each major bounce on an ascending trendline has coincided with an altcoin season. This occurred in 2017 and again in 2021. According to the data, a similar formation is currently underway in 2025.

The chart suggests the current market conditions mirror those of previous major rallies. “The technical setup now closely reflects the early stages of past altcoin surges,” the post read. The alignment of this trendline across multiple years adds strength to this historical pattern.
Golden Cross Patterns Support Bullish Altcoin Outlook
Golden Cross pattern on the Altcoins/US Dollar chart. A Golden Cross occurs when a short-term moving average crosses above a long-term moving average. This is widely viewed as a bullish indicator.
DefiWimar data indicates that Golden Crosses have consistently preceded rallies in the altcoin market since 2023. The latest cross occurred in October 2025, just before a projected rise toward the upper trendline, which is near the $600 billion level.
The chart shows that similar crossovers were followed by upward moves, suggesting that this pattern may again precede a rally. Wimar notes that if the pattern continues, the altcoin market could peak around December.
While no outcome is guaranteed, multiple technical signals are aligning. Analysts are watching for confirmation of these patterns to assess the next move in the altcoin cycle.
Disclaimer: This article is for informational purposes only and does not constitute financial advice. CoinCryptoNewz is not responsible for any losses incurred. Readers should do their own research before making financial decisions.


