

- The breakout above a downtrend line indicates a new push to bullish momentum, and some of the targets at the level of $0.79 are to be set.
- DYDX has maintained a good support level of above 0.50, which has served as a major fall-back to the ongoing induction.
- Though trading has been reducing, price action and formation depict that traders are gearing up to witness a breakout rally.
The technical structure of DYDX has changed as it has breached an essential downward-trending indicator. This action is after a clean re-test of horizontal support around 0.50, which has already been provided backward several times over the past couple of months. This break allows the token to be in a favorable position, with bullish momentum.
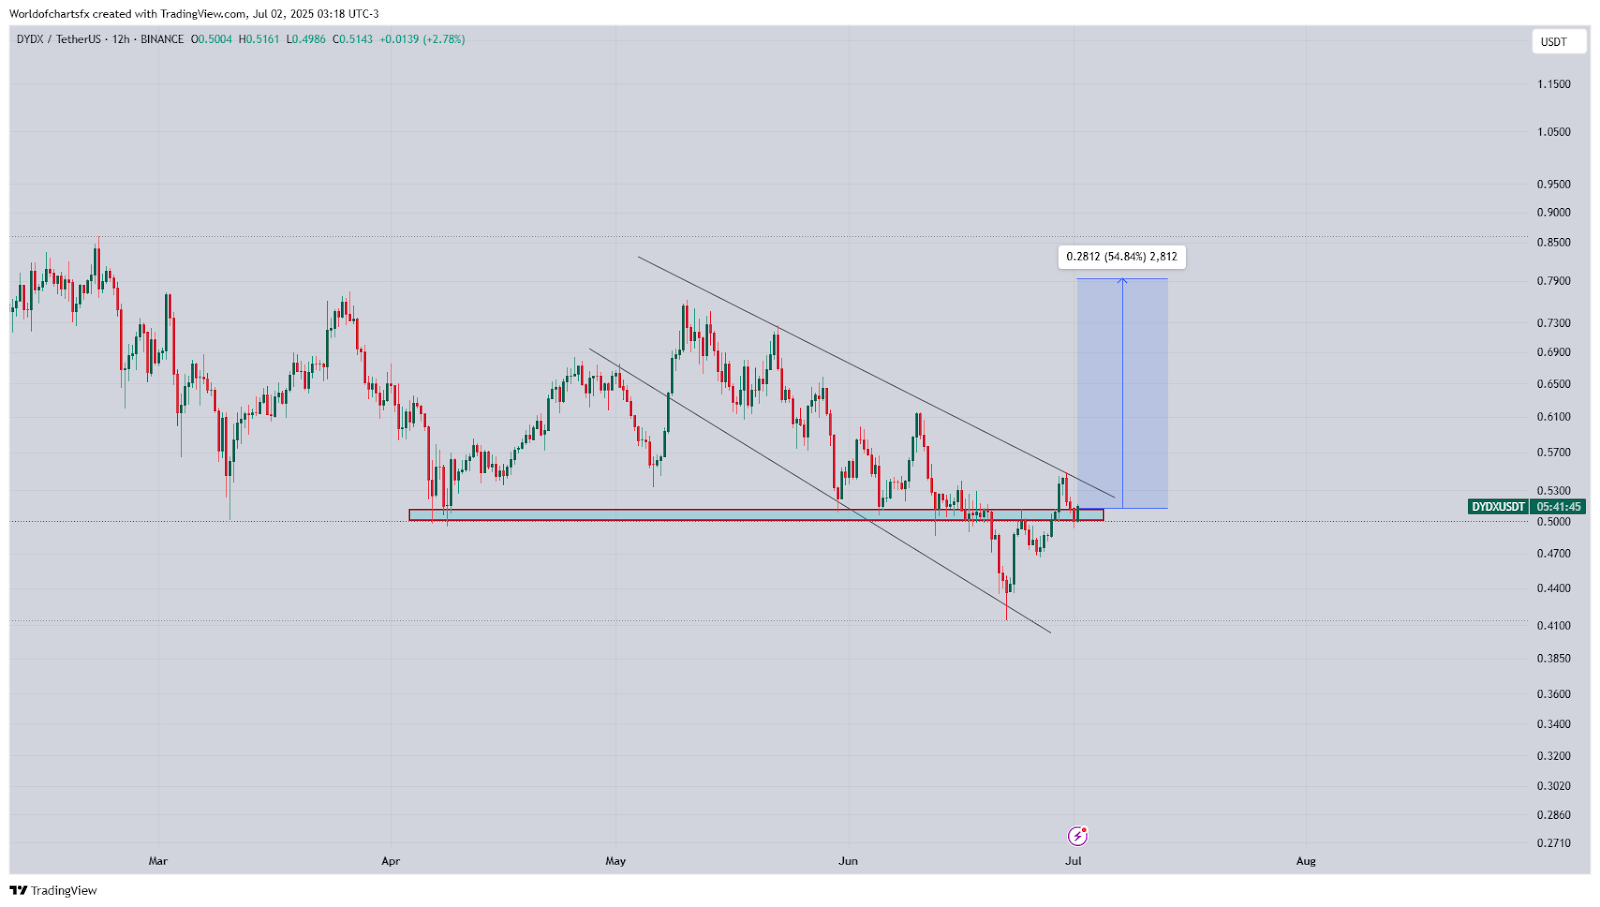
The recent price movement implies that the breakout may result in the creation of the mid-term target of about 0.79, as the potential increase will be 54.84 percent. The structural breakout is in tandem with the surging interest in the market, with traders positioning themselves in the event of further continuation. It is essential to maintain above the $0.50 mark because once maintained below, its position may nullify the present formation and change the short-term prospects.
Support Zone at $0.50 Remains a Key Bullish Trigger.
The price action of DYDX is continuing to be supported by the area at 0.50 as a solid anchor. This level has been proven and defended on a number of occasions as an area of significance in the present trading activity. The recent resistance activity has been above this mark, and the recent positive power of the price has given a good base.
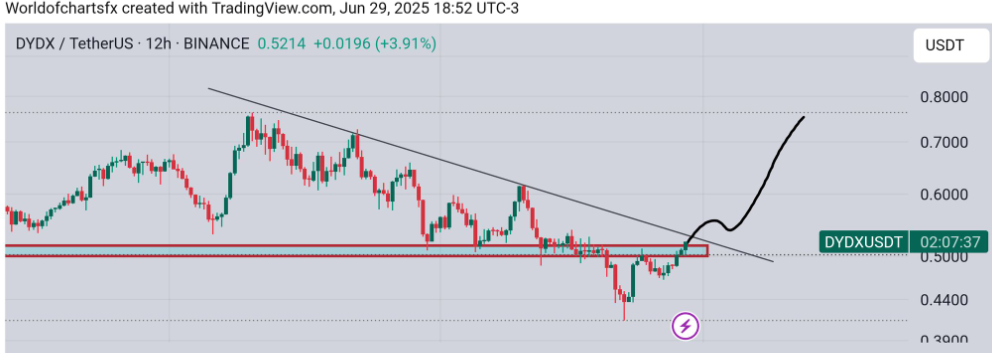
Participants in the market are observing whether there will be further power above the breakout zone. The break of the bullish scenario would be strengthened by price confirmation above the descending trendline and the support area. The 12-hour graph indicates that DYDX is trading at a range of about 0.52 with an upward momentum. An effective rebound of the fractured trendline might open the doors to an extended upsurge toward the increased resistance utilities ranging between 0.70 and 0.80.
Volume Trends Reflect Mixed Sentiment Amid Recovery
DYDX trading volume has fluctuated over the past few months. The perpetuals market showed strong spikes in April and May, suggesting active speculative interest. However, volume declined slightly as the price entered a consolidation phase in June. The reduced volume during price compression indicates some uncertainty among traders.

The recent breakout of zombies could attract interest, irrespective of the volume drop. DYDX is currently trading near significant resistance levels, and increased volume can help the bullish trend. To confirm the breakout, traders will seek a rise in purchase activity to revive the price to the anticipated $0.79.
With DYDX not having broken above essential levels, the market now has the clarification of whether it is indeed going to advance further. Technical indicators support the optimistic trend, but only if the asset can sustain the level above the crucial zone of $0.50.
Disclaimer: This article is for informational purposes only and does not constitute financial advice. CoinCryptoNewz is not responsible for any losses incurred. Readers should do their own research before making financial decisions.