

- ETH is stuck in a trading range of 3300-3950, with trade participants looking to break out in the trend direction again.
- In case ETH continues to fall to the bottom, significant areas of demand at values of 2,900 and 2,500 can become the focus of purchasing.
- The strength of ETH/BTC indicates that Ethereum and altcoins may gain momentum faster than Bitcoin.
Ethereum (ETH) remains trapped in a tight zone, which indicates an uncertain time in the cryptocurrency market. The price action has indicated a minimal range between the major resistance at around 3,950 and the support of roughly 3,300. This quiet down period has been dragging since June, and traders are keen to read any indications of a break or breakdown.
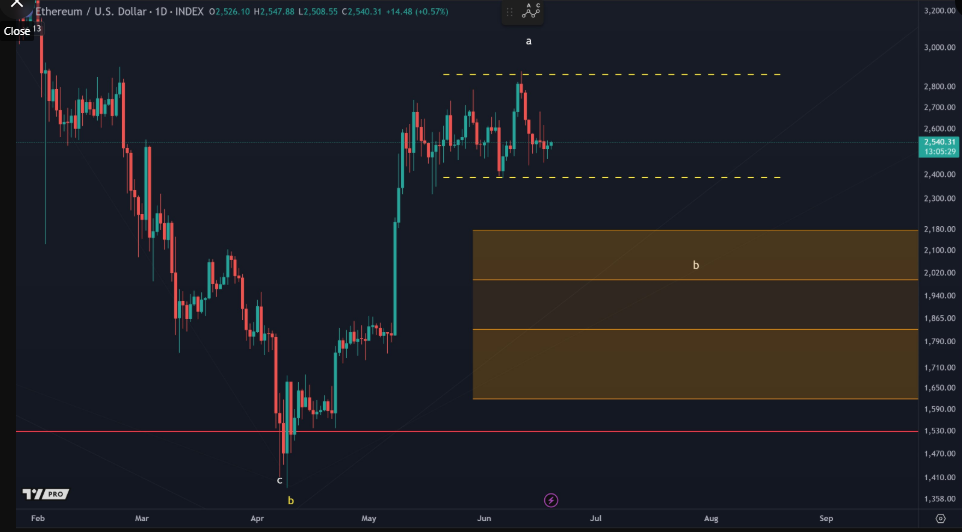
The current sideways trend has created a state of low volatility, with ETH failing to establish a clear directional bias. Chart patterns indicate repeated rejections near the upper resistance level, while the support area remains intact. The outlined horizontal range is attracting increased market attention, particularly as macroeconomic indicators and Bitcoin’s movement add further uncertainty to short-term expectations.
Demand Zones Highlight Buyer Interest Below Range
Below Ethereum’s current price range, technical analysis reveals two distinct demand zones spanning from around $2,900 to $2,500. These areas are marked by historical buying activity and are considered likely zones where buyer interest may increase if a breakdown occurs.
The highlighted zones have acted as accumulation areas in the past, signaling that institutional and retail participants could re-enter the market at lower price points. This arrangement risks downside in case the support at $3,300 is broken, but the formation stays neutral until either of the two points is convincingly broken.
ETH/BTC Pair Suggests Shift in Market Dynamics
Relative strength in Ethereum ETH/BTC trading pairs shows the Ethereum price in comparison to the Bitcoin price. The two have been consolidating above a significant support area, even though Bitcoin in general has been experiencing stagnation. The above departure indicates that Bitcoin may be experiencing a shift of capital to Ethereum and other alternative tokens.
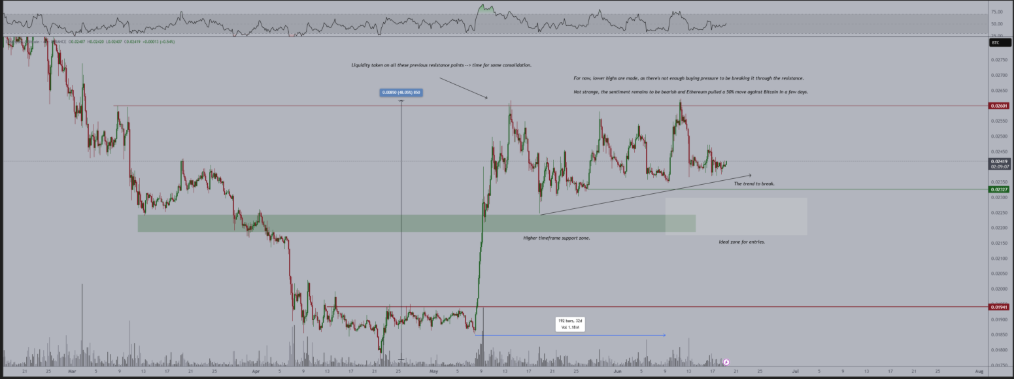
The present lateral pattern has pushed the price in a low volatility condition, and ETH does not show a definite bias despite numerous attempts. There are chart patterns that show rejections of prices in several attempts at approaching the upper resistance area, whereas the support territory is unaffected. The described horizontal range is drawing more attention to the market, especially because macroeconomic indicators and the movement of Bitcoin are bringing more ambiguity to the near-term expectations.
Disclaimer: This article is for informational purposes only and does not constitute financial advice. CoinCryptoNewz is not responsible for any losses incurred. Readers should do their own research before making financial decisions.