

- Litecoin is trading without conviction but in a falling wedge which frequently indicates the possibility of a bullish turnaround.
- LTCBTC has been languishing behind Bitcoin since 2018, pennies to the dollar, and with little volatility.
- Reclaiming 0.0012-0.0015 BTC would be the only reclaim that would point to actual reversal, but indicators are still in speculative mode.
Litecoin ended the previous session with indecisive movement, showing no clear strength in either direction. The LTCBTC pair, however, still holds within a falling wedge structure. Technical analysts generally view this formation as a possible bullish reversal.
The setup suggests that Litecoin could advance if Bitcoin maintains its relative strength. Falling wedge formations usually point to a breakout, but confirmation is needed. Traders anticipate that upward momentum in Bitcoin may extend Litecoin’s potential upside.
At the same time, market participants focus on short-term opportunities. Lower-time frame formations provide signals for quick entries and exits. Such approaches highlight strategies built around capturing smaller price moves instead of waiting for prolonged developments.
Monthly Chart Performance
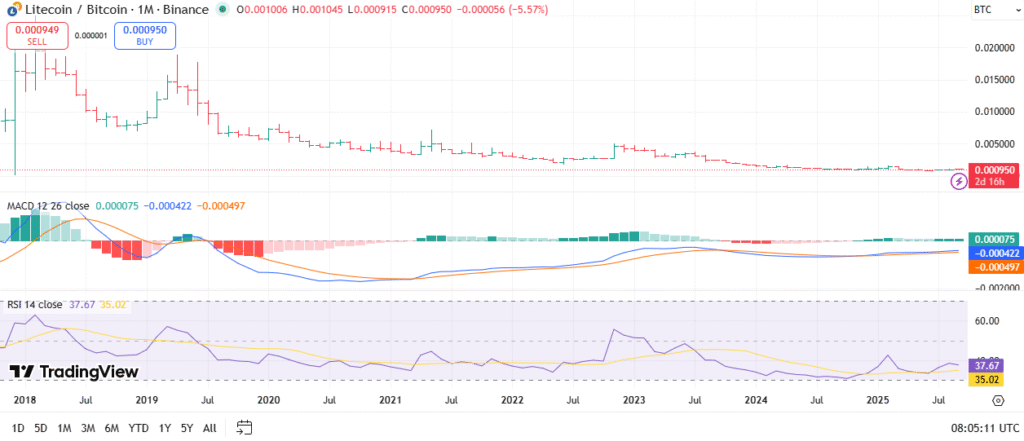
The long-term view reveals a prolonged decline in LTCBTC since its 2018 peak near 0.02 BTC. The pair now trades around 0.00095 BTC, marking heavy underperformance against Bitcoin. Monthly candles show consolidation near multi-year lows with reduced volatility.
Source: Tradingview
Momentum indicators show signs of stabilization. The MACD line has crossed above its signal line, but both remain close to neutral levels. Meanwhile, histogram bars flatten, reflecting weak momentum but less bearish pressure.
Relative strength remains subdued. The RSI reads 37.67, which is above oversold territory yet still under the neutral 50 line. This positioning implies persistent weakness but early signals of accumulation.
Key Implications
Litecoin lags Bitcoin on longer horizons, struggling near record lows in comparative value. Despite this, indicators suggest that downside pressure is easing. The chart reflects more stability than recent years.
Technical signals point toward potential base formation. Both MACD and RSI suggest reduced selling pressure, though they stop short of confirming a reversal. Stabilization without strong breakout levels keeps the outlook speculative.
A recovery depends on higher levels. LTCBTC must reclaim at least 0.0012 BTC or 0.0015 BTC to confirm any trend shift. Until then, Litecoin remains at risk of extended underperformance.