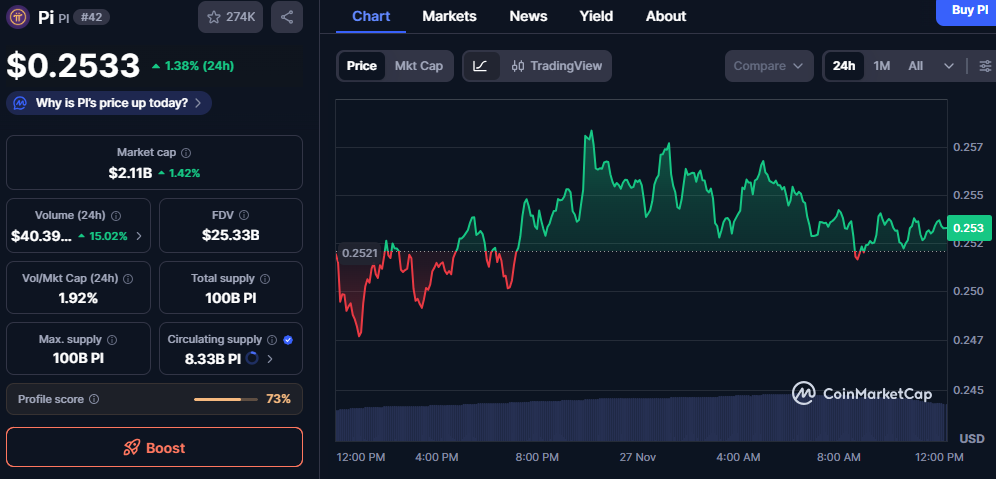
- Pi continues to trade within a tight range and maintains stability even as several digital assets face wider price swings.
- Steady volume near $40M and a market cap above $2.1B show that participation remains consistent.
- Pi’s trend remains closely tied to Bitcoin’s direction, and its balanced structure indicates room for stronger motion if sentiment improves.
Pi trades near the $0.25 level as the market shows a mild upward shift and steady movement across major pairs. Pi holds this position with stable behavior while other assets record wider swings during the latest session. Moreover, Pi maintains its structure as activity increases across several mid-cap names within the sector.
Pi Price Movement and Market Behavior
Pi trades around $0.253 and remains stable within a narrow range throughout the session. It moves between small boundaries and forms a pattern that reflects steady trading interest. Additionally, this structure shows that Pi maintains its ground without strong upward or downward pressure.
Short-term movement highlights repeated recoveries as minor dips appear during regular intraday action. These movements shape a clear base and support a balanced performance over the recent period. Moreover, the chart reflects this steady behavior with multiple rebounds at lower levels.
Market sentiment surrounding Pi remains neutral as the asset holds above recently tested support areas. It avoids deeper weakness during intraday shifts and continues to stabilize near current levels. Additionally, this position strengthens its standing among active mid-cap digital assets.
Market Structure, Supply Metrics, and Volume Activity
Pi records a market cap above $2.1B and moves in line with its modest daily price increase. The circulating supply stands far below the total supply, and this creates a wide gap between market cap and long-term valuation. Moreover, this structure highlights how future distribution phases may shape the asset’s long-term direction.

Source: Coinmarketcap
Volume rises above $40M and reflects stable participation without major surges in activity. This movement shows regular engagement across trading pairs and supports the asset’s steady performance. Additionally, the volume-to-market-cap ratio signals limited speculative movement compared with higher-volatility assets.
Support near $0.20 remains important because Pi held this level during a recent market pullback. This strength reinforced the base and shaped a clearer path as conditions stabilized across the broader market. Moreover, holding this zone improved expectations for continued resilience.
Trend Structure, Market Correlation, and Forward Outlook
Pi continues to show a strong link with Bitcoin behavior and often responds when BTC approaches major thresholds. This connection may support stronger action if BTC attempts to recover previous highs in the next cycle. Additionally, Pi maintains enough stability to benefit from any improvement in broader market sentiment.
The chart shows a steady consolidation pattern as Pi moves within a predictable band around $0.25. Each bounce from lower levels adds structure, while repeated upper-range tests indicate consistent resistance. Moreover, this setup keeps the asset in a controlled phase with limited downside risk.
Pi holds a rank near the top 50 and maintains a competitive position among mid-cap digital assets. Its steady behavior and rising activity support expectations for gradual improvement as conditions evolve. Additionally, the asset may attempt to move beyond $0.257 if stronger momentum appears in the coming sessions.
Disclaimer: This article is for informational purposes only and does not constitute financial advice. CoinCryptoNewz is not responsible for any losses incurred. Readers should do their own research before making financial decisions.


