
- Solana price closes September 7 at $104.97, down 1.4%, after failing to clear resistance near $107.
- Ash Crypto identifies improving monthly indicators, although the anticipated bullish MACD crossover is not confirmed.
- Moving averages place initial support near $103–$104, while the liquidation heatmap shows a major cluster around $108.
Solana price closed September 7 at $104.97, down 1.4%, after buyers failed to clear resistance near $107. SOL touched $106.80 before retreating to $104.22 during the session.
Monthly indicators offer a more positive interpretation, while shorter charts suggest another support test. Analysts differ over timing, with bullish reversal signals developing alongside negative money flow and nearby concentrations of leveraged positions.
Monthly Solana price signals contrast with pullback risks
Ash Crypto identifies three developments supporting his bullish outlook. He cites the first green monthly candle in 10 months and a monthly RSI breakout above a two-year downtrend.
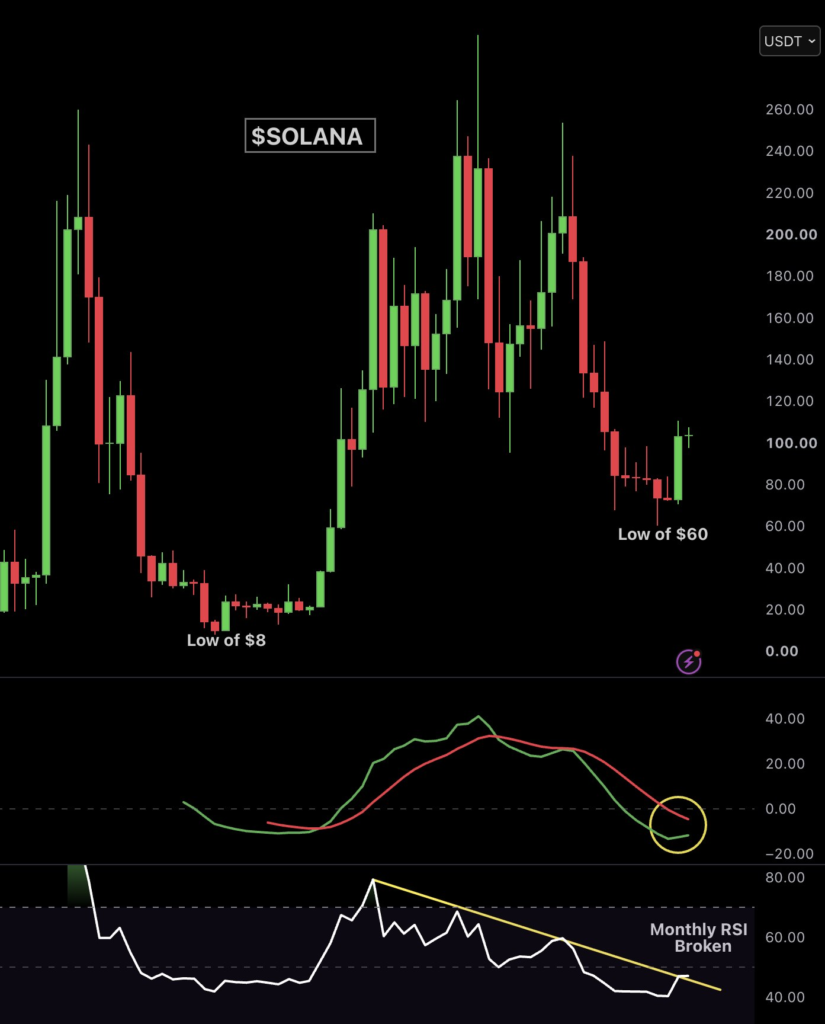
The analyst also says monthly MACD is approaching a bullish crossover. That signal is still pending, so his Solana price interpretation describes a developing reversal rather than confirmation.
Meanwhile, More Crypto Online places SOL within a corrective fourth-wave range. Its Elliott Wave analysis anticipates another C-wave move toward support, consistent with its broader consolidation assessment.
Crypto Tony takes a cautious trading stance, saying the rejection and liquidity sweep he wanted have not occurred. He is waiting for that test before opening a short.
These views address different timeframes. A short-term correction could occur while monthly momentum improves, without automatically invalidating the longer-term setup.
Moving averages and liquidation clusters frame next move
Solana price holds above its four-hour moving averages, with the 20-period average at $103.93 and the 50-period at $102.98. Together, they define initial support around $103–$104.
Below that zone, the 100-period average sits at $101.26, followed by psychological support at $100. Chaikin Money Flow reads -0.15, indicating selling pressure despite the bullish moving-average alignment.
CoinGlass’ liquidation heatmap places a major nearby cluster around $108. A Solana price recovery through $106.80–$107.50 could expose that level and potentially force short covering.
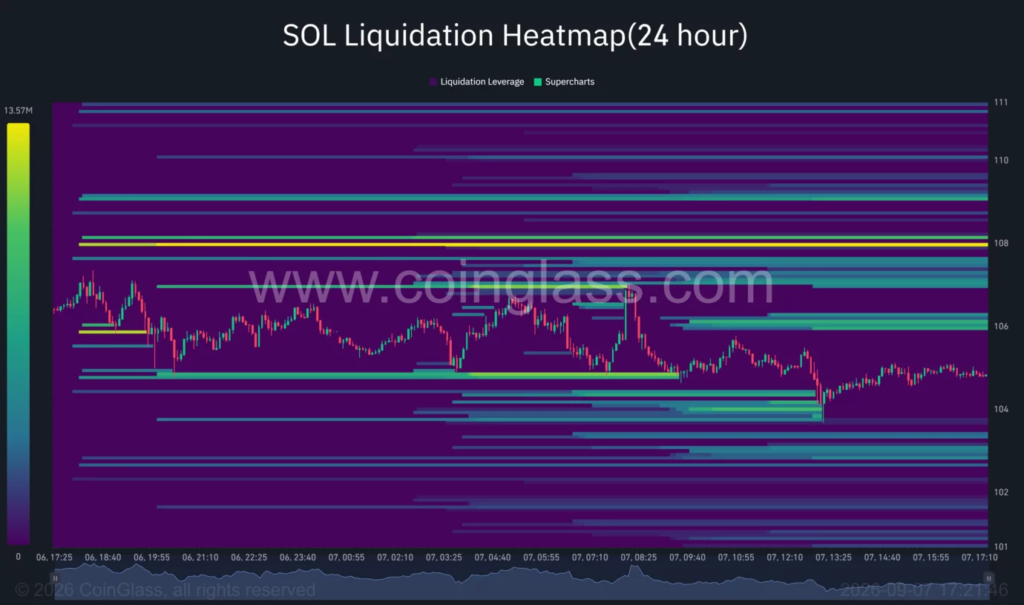
Further overhead clusters appear near $108.80, $109.50 and $110. Downside concentrations sit between $103 and $104, with another around $102.50.
A daily close below $100 would shift attention toward $95 and Supertrend support at $90.68.
Disclaimer: This article is for informational purposes only and does not constitute financial advice. CoinCryptoNewz is not responsible for any losses incurred. Readers should do their own research before making financial decisions.