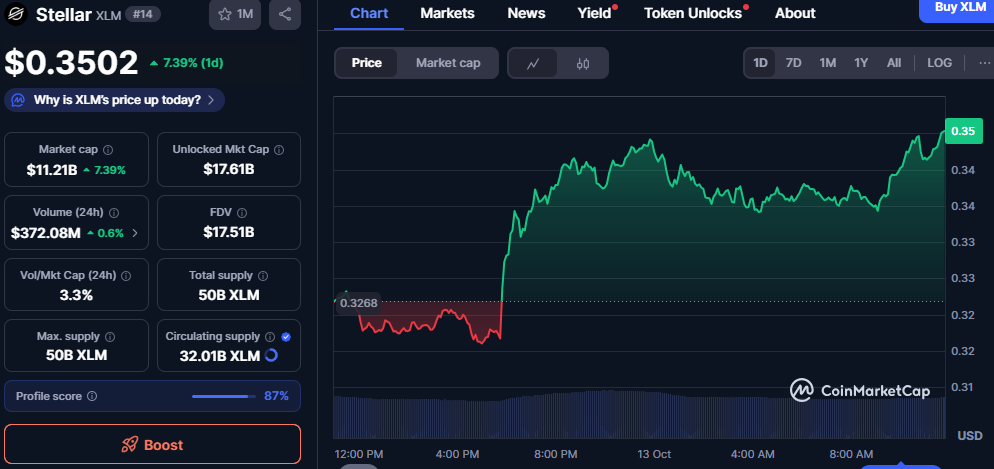
- XLM’s sharp 7.39% rise to $0.35 signals a confirmed breakout, marking renewed momentum after a period of consolidation.
- With an $11.21 billion market cap and $372 million in trading volume, XLM’s growth reflects steady liquidity and genuine market engagement.
- The pattern of higher highs and stable support above $0.33 suggests sustained accumulation, reinforcing Stellar’s bullish technical structure.
Stellar (XLM) registered a sharp upward movement as its price climbed to $0.3502, marking a 7.39% rise in 24 hours. The increase reflected renewed buying strength and a shift in short-term market sentiment. The trading pattern displayed a clear breakout above $0.33, confirming sustained momentum after a period of consolidation.
The breakout indicated strong participation as the price maintained a steady upward trend through the day. This consistent growth established a new technical foundation and confirmed resilience across market conditions. The move also positioned Stellar among the leading gainers in the day’s market performance.
The session’s steady climb followed several days of tight trading activity. As a result, the move above resistance demonstrated renewed confidence in the asset’s long-term potential. The sustained pattern signaled that the rally was supported by real trading activity rather than speculative spikes.
Market Strength and Capital Expansion
Stellar’s market capitalization increased to $11.21 billion, aligning closely with the day’s price growth. The 24-hour trading volume reached $372 million, reflecting consistent activity and stable liquidity. A volume-to-market-cap ratio of 3.3% underscored the rally’s strength and steady participation.

Source: CoinMarketcap
The fully diluted valuation stood at $17.51 billion, highlighting potential value growth if all tokens enter circulation. The unlocked market cap of $17.61 billion reflected healthy distribution and transparency. These indicators demonstrated an active and sustainable trading environment for XLM.
Broader market conditions also supported Stellar’s momentum as capital flowed into major altcoins. The coin’s positive performance strengthened its short-term outlook within this trend. As a result, Stellar continued to show competitive positioning in the current market cycle.
Technical Structure Confirms Bullish Setup
The breakout above $0.33 confirmed a key structural change in Stellar’s price pattern. The chart showed higher highs and higher lows, reflecting steady accumulation. If prices remain above the new support zone, the setup could drive continued upward momentum.
The asset’s profile score of 87% reinforced its strong fundamentals and technical reliability. Sustained price action indicated ongoing demand, with stability across short retracements. This combination pointed toward a durable bullish configuration.
In conclusion, Stellar (XLM) showed a decisive technical recovery backed by consistent volume and solid capitalization growth. The breakout and consolidation above $0.33 established a base for potential near-term expansion. Continued momentum could keep XLM positioned strongly in the broader digital asset market.
Disclaimer: This article is for informational purposes only and does not constitute financial advice. CoinCryptoNewz is not responsible for any losses incurred. Readers should do their own research before making financial decisions.


