

- SUI shows oversold conditions on the 4-hour chart, with bullish divergence hinting at a potential rebound.
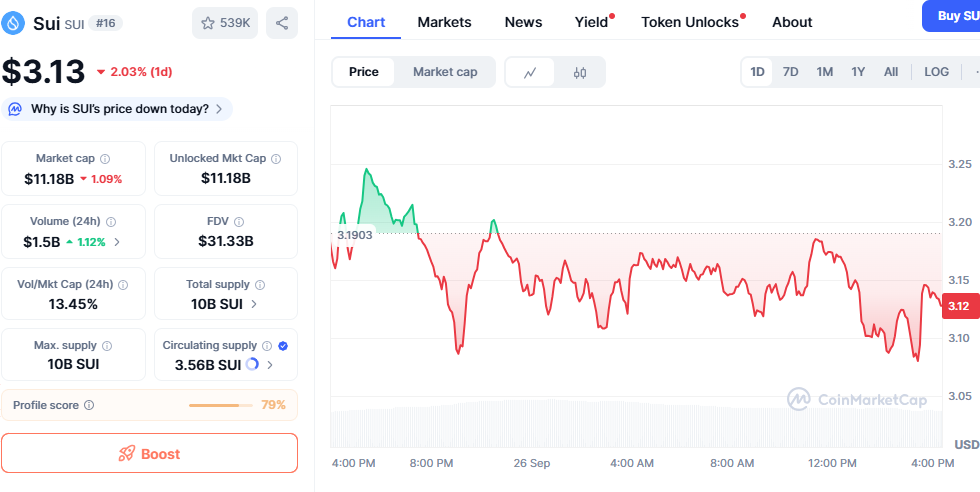
- With an $11.18B market cap and $1.5B daily volume, SUI maintains high liquidity and strong market activity.
- Only 36% of total supply is in circulation, meaning future token unlocks could significantly impact price volatility.
SUI’s price action on the four-hour chart shows oversold conditions with a clear bullish divergence on the RSI indicator. The token has been forming lower lows, yet momentum indicators suggest higher lows, pointing toward a potential reversal. Support zones marked in orange and yellow highlight possible areas for renewed buying interest.
Technical levels remain significant, with Fibonacci retracement levels showing possible resistance between the 0.618 and 0.786 bands. If momentum strengthens, these levels may cap the next rebound attempt. Volume confirmation or candlestick patterns could validate the reversal outlook and provide direction.
Market participants recognize these conditions as signs of weakening selling pressure. However, confirmation is still necessary, as the short-term structure remains volatile. A breakout above resistance could provide a clearer trend shift.
Price Performance and Market Standing
SUI trades at $3.13 after recording a 2.03 percent decline over the last 24 hours. Despite this drop, trading activity increased, with daily volume climbing to $1.5 billion. This indicates consistent demand and continued participation in the token’s market activity.
Source: Coinmarketcap
The token maintains a strong market capitalization of $11.18 billion, placing it among the largest digital assets. Its fully diluted valuation of $31.33 billion underscores the impact of total supply potential. Unlocked supply remains at 3.56 billion SUI out of 10 billion, reflecting only 36 percent circulation.
This distribution indicates future supply unlocks could influence volatility and pricing behavior. Circulating supply dynamics often shape token stability during periods of market uncertainty. As a result, long-term positioning continues to draw significant attention.
Short-Term Weakness vs. Long-Term Outlook
On the daily timeframe, SUI shows a sharp decline from $3.19 followed by sideways consolidation. The price pattern suggests hesitation, with buyers and sellers balancing around current levels. Momentum remains undecided, reflecting broader market sentiment.
Nevertheless, elevated volume highlights enduring engagement despite short-term weakness. This factor provides a foundation for potential rebounds if technical levels align with stronger momentum. Resistance zones remain critical checkpoints for the next move.
In the long run, strong capitalization and high activity underpin SUI’s structural strength. Yet, supply unlocks and market direction will determine sustainability. Traders will monitor both elements to assess whether recovery transitions into longer-term growth.
Disclaimer: This article is for informational purposes only and does not constitute financial advice. CoinCryptoNewz is not responsible for any losses incurred. Readers should do their own research before making financial decisions.